How to Read a Heat Index Chart Before Summer Plans
- What a Heat Index Chart Shows About Temperature and Humidity
- How to Read the Rows, Columns, and Risk Colors Correctly
- Why the Same 90°F Air Temperature Can Feel Very Different
- What the NOAA and OSHA Heat Index Charts Mean
- How to Use a Printable Heat Index Chart Away From Home
- How Summer Plans Should Change Across Humid U.S. Regions
- How Portable Power Can Support a Heat-Aware Setup
- Check the Chart Before You Go
- FAQs
Summer plans can look reasonable until humidity turns heat into harder conditions outdoors. A heat index chart helps you check this risk before you leave home. Match air temperature with relative humidity to estimate how hot conditions may feel, then compare that result with the chart’s risk levels for the same hour. Check the chart before you commit to outdoor plans.
What a Heat Index Chart Shows About Temperature and Humidity
First, separate the heat index from the number shown on a thermometer. Air temperature measures the surrounding air. Relative humidity describes how much water vapor is present compared with the maximum the air could hold at that temperature. A heat index chart combines those values to estimate an apparent, or feels-like, temperature.
The result matters because the body relies partly on sweat evaporation to release heat. Humid air slows that evaporation. Sweat may remain on the skin while the body has a harder time cooling itself. This is why a hot, humid afternoon can feel much more stressful than a hotter but drier day.
Most U.S. charts use degrees Fahrenheit for both the measured air temperature and the resulting heat index. Relative humidity appears as a percentage.
Air Temperature
Temperature values usually run down the left side in rows. Find the forecast high for the place and hour of your activity. Do not use a statewide forecast or a reading from many hours earlier if a local hourly forecast is available.
Relative Humidity
Humidity percentages usually run across the top in columns. Choose the relative humidity expected at the same time as the temperature. Morning humidity can be high while temperature is lower. Afternoon humidity may fall as temperature rises, so mixing values from different hours can produce a misleading result.
Feels-Like Temperature
The cell where the correct row and column meet gives the estimated heat index. For example, the National Weather Service chart shows that an air temperature of 96°F with 65% relative humidity produces a heat index of 121°F. That number does not mean the thermometer will reach 121°F. It describes estimated heat stress under the chart’s assumptions.
How to Read the Rows, Columns, and Risk Colors Correctly
Next, use the same sequence each time you check the chart.
Find the air temperature row for the expected location and hour.
Move across to the column showing relative humidity for that same hour.
Read the number where the row and column intersect.
Check the background color or legend for the related risk category.
Adjust for sunlight, activity, clothing, age, health, and access to cooling.
Caution
On the common NOAA heat index chart, 80°F through 90°F is the Caution range. Fatigue may occur with prolonged exposure or physical activity. This is already a reason to plan water, shade, and breaks, especially for people who are not used to the heat.
Extreme Caution
Values above 90°F through 103°F fall within Extreme Caution. Heat cramps or heat exhaustion are possible with prolonged exposure or activity, and heat stroke is also possible. A long line, strenuous game, or unshaded hike deserves a closer look at timing and exit options.
Danger and Extreme Danger
Values above 103°F through 124°F fall within Danger. Heat cramps or heat exhaustion are likely with prolonged exposure or activity, while heat stroke is possible. At 125°F or higher, the chart marks Extreme Danger, where heat stroke is highly likely with continued exposure. These colors describe increasing risk, not a countdown showing how long everyone can remain outside safely.
Why the Same 90°F Air Temperature Can Feel Very Different
Now consider one temperature across several humidity levels. At 90°F and 40% relative humidity, the standard chart gives a heat index close to 91°F. At 60% humidity, it rises to about 100°F. At 70%, it reaches about 106°F. A single temperature forecast can therefore sit in different risk categories.
This difference comes from slower sweat evaporation in humid air. Wind may help in some conditions, although very hot wind can add heat.
People also respond differently. Recent arrival from a cooler climate, strenuous effort, heavy clothing, certain health conditions, some medications, age, and previous heat illness can affect risk. The chart cannot measure those factors. Treat the result as a planning signal rather than a personal safety limit.
What the NOAA and OSHA Heat Index Charts Mean
At this point, check which chart you are using. Search results for a NOAA heat index chart and an OSHA heat index chart may lead to graphics with different colors or category boundaries because they serve different purposes.
NOAA Chart
The NOAA and National Weather Service version is designed for public weather information. Its familiar bands are Caution, Extreme Caution, Danger, and Extreme Danger. The values assume shade and light wind. Direct sunlight can make conditions feel up to about 15°F hotter, so an exposed festival line or asphalt lot may be riskier than the printed cell suggests.
OSHA Chart
Workplace materials use heat index as an initial screening tool, not a complete exposure assessment. OSHA emphasizes that a forecast heat index does not account for direct sun, radiant heat, workload, protective clothing, limited air movement, or heat generated by equipment. Conditions at a worksite may also differ from the nearest weather station.
For occupational decisions, an employer should not rely only on a printable chart. On-site conditions and job demands matter, and wet bulb globe temperature may provide a more complete assessment. Workers should follow the employer’s heat plan, training, rest schedule, water access, and emergency procedures. A recreational visitor should not simply copy workplace thresholds; personal exposure still needs its own check.
How to Use a Printable Heat Index Chart Away From Home
For travel, a heat index chart printable on one page can be useful when cell service is weak. Save a current, legible version from an official weather source. Keep the temperature units, humidity columns, color legend, shade assumption, and source visible. A cropped image without its notes is easy to misuse.
For each planned stop, record four items beside the chart: expected temperature, relative humidity, calculated heat index, and whether the site offers shade or indoor cooling. Recheck the forecast on the day of travel. If temperature or humidity changes, calculate the intersection again instead of carrying yesterday’s result forward.
How Summer Plans Should Change Across Humid U.S. Regions
In July and August, high humidity commonly affects the Southeast, Gulf Coast, and parts of the Midwest. Conditions still vary, so use local hourly values for each destination.
Road Trips and RV Stops
Check the heat index for fuel stops, overlooks, camp setup, and roadside waits, rather than only for driving time. Move longer walks to earlier hours when conditions are lower. Choose stops with shade or indoor access. Never leave children, pets, or anyone needing assistance in a parked vehicle, even during a short errand. Pack a portable fan and cold drinks for waits at fuel stops, trailheads, or scenic overlooks, and note indoor rest points along the route.
At an RV site, confirm whether electrical hookups, tree cover, bathhouses, or cooled common rooms are available. Test fans and cooling equipment before departure. Keep drinking water accessible inside the vehicle, not buried under luggage. Build flexibility into arrival time so setup does not have to happen during the afternoon peak.
Outdoor Sports and Queues
Check the exact hours for warmups, games, races, amusement park lines, and festival entry. A shaded seating area does not make an exposed parking walk safe by default. Shorten strenuous sessions, increase rest opportunities, and identify where someone can cool down. Follow organizers’ cancellation policies and heat instructions. Bring a portable fan and cold drinks for the wait, and identify the nearest indoor or shaded cooling point before joining the line.
If a participant becomes confused, faints, has a seizure, or shows other signs of heat stroke, call 911 and begin rapid cooling while help is coming. Do not wait for the chart color to confirm an emergency. Symptoms and the person’s condition take priority over a forecast number.
Backyard Gatherings
For a patio meal or neighborhood party, check the index for setup time and the gathering itself. Provide shade, cold nonalcoholic drinks, fans, and an indoor rest area. Shift cooking away from crowded seating. Guests should know they can step inside or leave early without disrupting the plan.
How Portable Power Can Support a Heat-Aware Setup
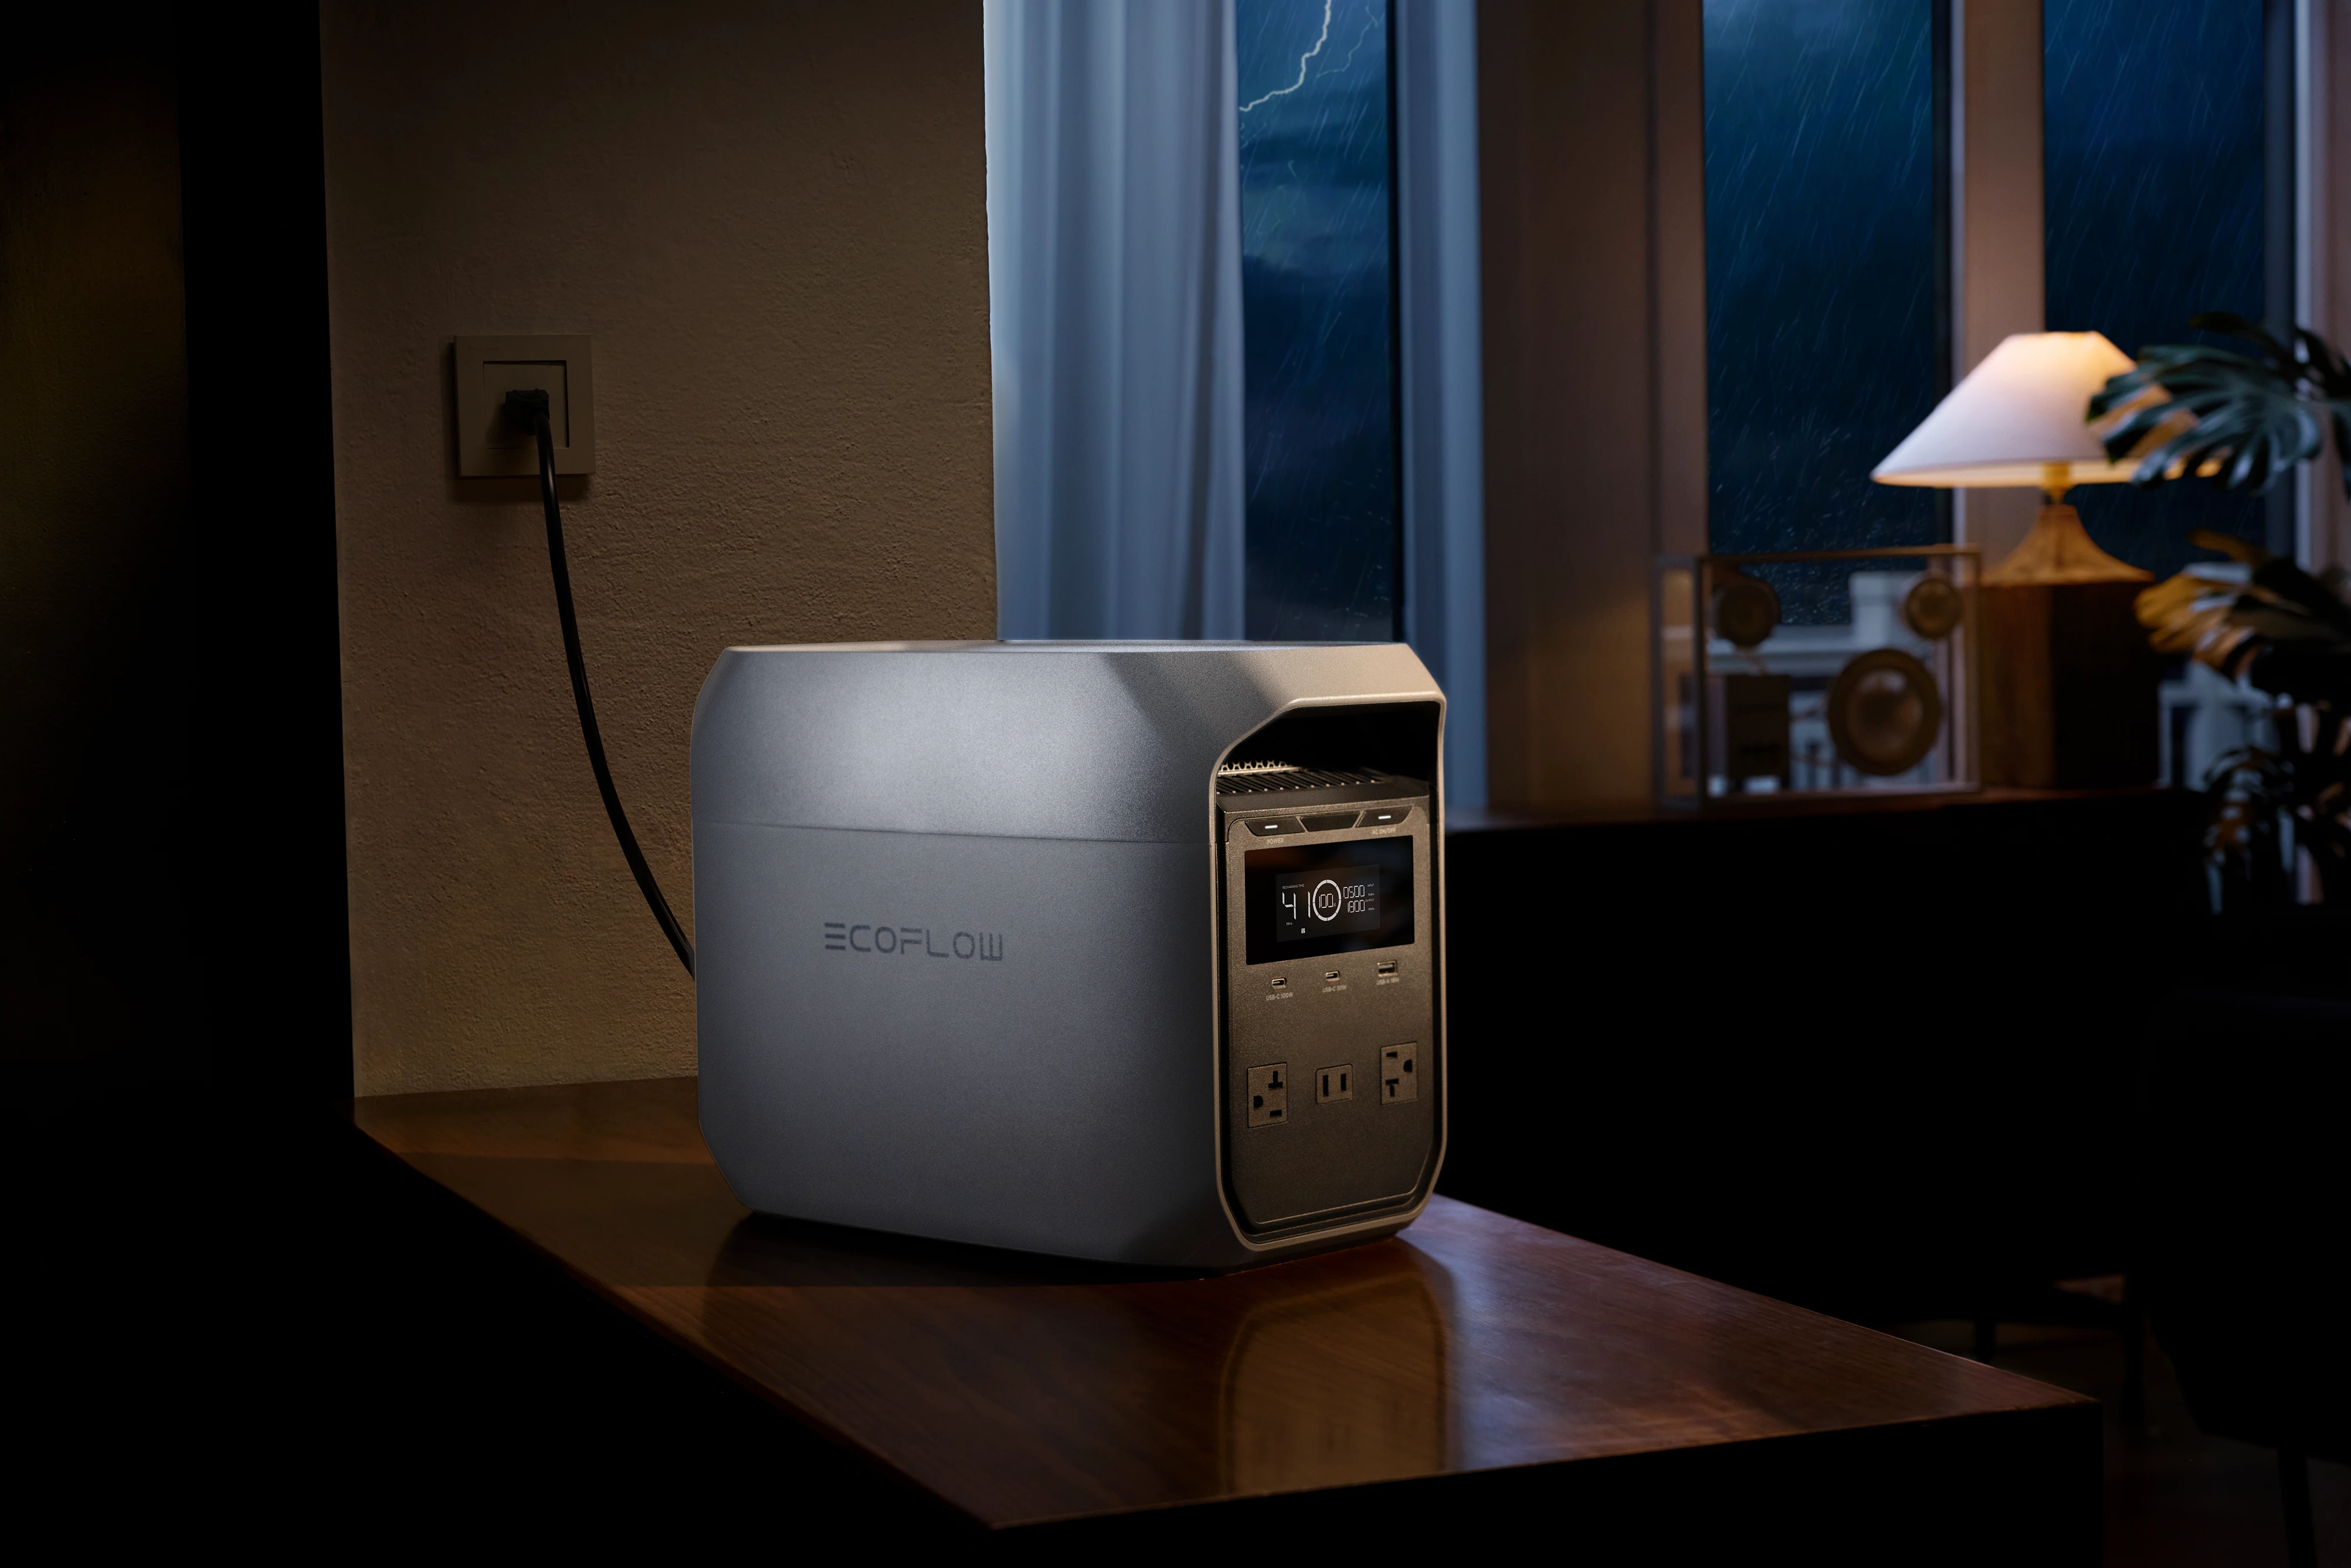
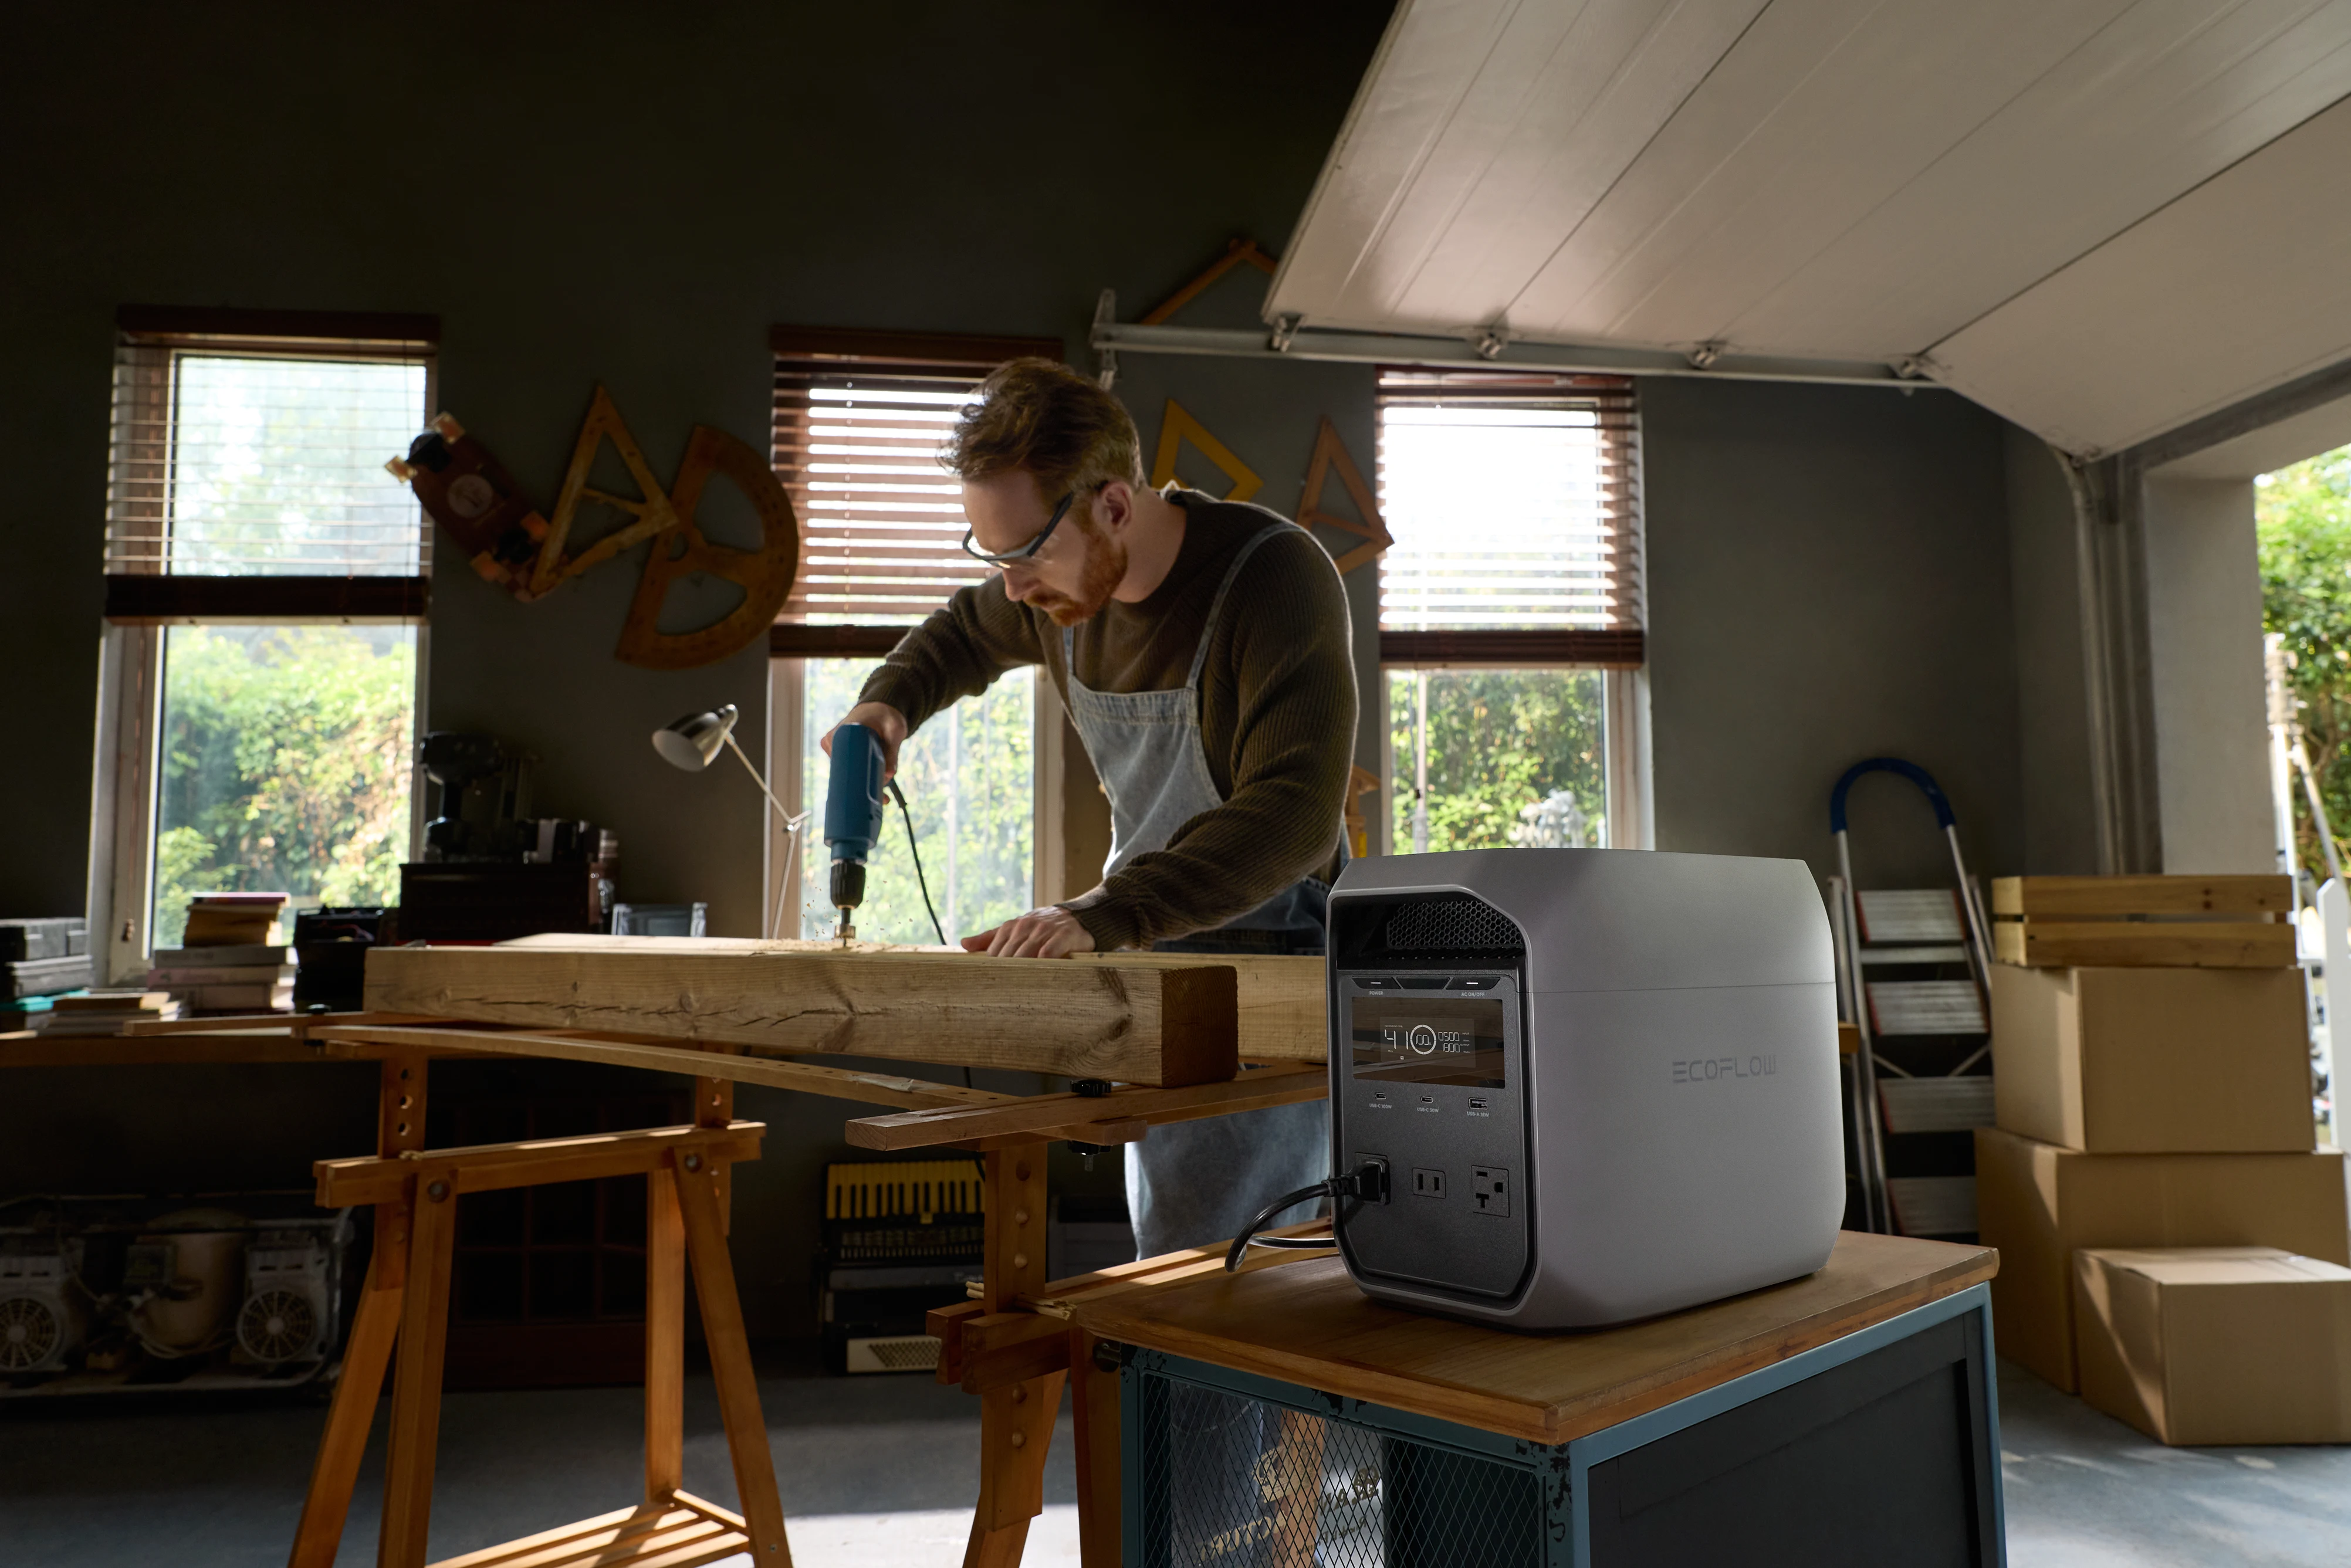
Power planning comes later, after timing, shade, hydration, and access to real cooling have been addressed. At a car-accessible campsite, RV stop, or backyard gathering, the EcoFlow DELTA 3 Classic provides 1,024Wh of capacity and 1,800W AC output. It can support phones, a mobile hotspot, portable fans, LED lighting, a mini-fridge, or a car cooler when loads remain within its ratings.
Runtime depends on each device’s wattage, cycling behavior, temperature, and conversion losses. Add the running watts of connected devices and check startup demand for compressor-based coolers. Keep the unit shaded, dry, ventilated, and within the operating limits in its manual.
A portable power station does not lower the heat index and should never be presented as a substitute for whole-home air conditioning, a cooled public building, or emergency care. Prioritize communication and low-power essentials. If conditions exceed what the location and equipment can manage, change the plan or move indoors.
Check the Chart Before You Go
A heat index chart turns temperature and humidity into a practical warning for summer plans. Match values from the same place and hour, read the risk color, then account for sun, effort, clothing, and cooling access. Check local alerts before leaving, revise exposed activities when risk rises, and keep a printable copy as backup. Make the safer schedule choice today.
FAQs
Q1: Can a Heat Index Chart Predict Conditions in Direct Sunlight?
No, not by itself. Standard values assume shade and light wind. Direct sun can add substantial heat stress, so use the chart with local alerts, exposure time, surface conditions, and access to shade.
Q2: Is the OSHA Heat Index Chart Suitable for Planning a Family Outing?
Sometimes, as a supplemental reference. OSHA materials focus on occupational exposure and workload. For a family outing, use the National Weather Service forecast first, then account for activity, age, health, sun, and cooling options.
Q3: Should I Use Morning Humidity With the Afternoon High Temperature?
No, unless both are forecast for the same hour. Relative humidity often changes as temperature changes. Match hourly temperature and humidity from the same location and time to avoid an inflated or understated heat index.
Q4: Does a Lower Relative Humidity Always Make 100°F Conditions Safe?
No, never automatically. Very high air temperature can still create dangerous heat stress, especially with sun, exertion, hot wind, or limited water. Check official alerts and reduce exposure even when humidity appears modest.
Q5: Can I Rely on a Printable Heat Index Chart for a Road Trip?
Usually no, unless paired with current forecasts. The sheet can calculate combinations offline, but it cannot show changing weather or active alerts. Update temperature and humidity at each stop whenever service becomes available.
For press requests or interview opportunities, reach out to our media team
media.na@ecoflow.com