PV Panel Output Calculator: Estimate Your Solar Energy Production
Two homes can install the same number of solar panels and finish the year with noticeably different production. One roof may lose its afternoon sun behind a maple tree; the other may face southwest with nothing in the way. Panel wattage can’t capture that difference because it comes from controlled test conditions. A PV panel output calculator provides a more useful planning estimate based on system capacity, local peak sun hours, and expected real-world losses.
How Do You Calculate Solar Panel Output?
For an early estimate, multiply the array’s rated capacity by the average peak sun hours at the site, then apply a system-efficiency factor. The result is energy in kilowatt-hours rather than instantaneous power in kilowatts.
This distinction matters. A 7-kilowatt array describes how much DC power the modules can produce under standard test conditions. An estimate of 26 kilowatt-hours describes how much energy that array may generate over an entire day. Understanding how to calculate solar panel output starts with three factors: the system’s rated capacity, the peak sun hours available at your location, and the expected performance losses. Together, these values provide a useful estimate of daily energy production in kilowatt-hours (kWh).
Determine Your Solar System’s Rated Power
Begin with the nameplate wattage of one panel and the number of panels in the array. Current residential projects often use modules from roughly the mid-300-watt to low-400-watt range, but the exact figure should come from the product data sheet.
Suppose a contractor proposes twenty 400-watt modules. Their combined rated DC capacity is:
20 panels × 400 W = 8,000 W (or 8 kW)
The 8 kW figure is the array’s DC nameplate capacity. It is not a promise that the system will deliver 8 kW to the house throughout a sunny day. Module ratings are measured under standard test conditions, including irradiance of 1,000 watts per square meter and a cell temperature of 77°F. A roof rarely holds those conditions for long.
Check whether a proposal lists DC or AC capacity. The panel total is normally expressed in DC watts, while the inverter has an AC rating. The values need not be identical, but the difference should be deliberate and reflected in the production model. When comparing system options, use a solar calculator to choose the right solar panels for your estimated energy needs and available roof space.
Find Peak Sun Hours for Your Location
Daylight hours are not the same as peak sun hours. A summer day may provide 14 hours between sunrise and sunset, yet the early morning and late afternoon sun is much weaker than midday sunlight.
Peak Sun Hours (PSH) express the solar energy received over a day as the equivalent number of hours at an intensity of 1,000 watts per square meter. A day delivering 4.5 kilowatt-hours of solar energy per square meter is described, for this purpose, as having 4.5 peak sun hours.
The Southwest commonly receives a stronger annual solar resource than the Pacific Northwest or Great Lakes region. Even within one city, tree cover, roof direction, slope, nearby buildings, and localized weather can give two roofs different results.
Use an address-based resource such as NREL’s PVWatts Calculator when possible. It uses location-specific weather and solar-resource data and accepts inputs for system size, module type, orientation, tilt, and losses. State or citywide figures are suitable for an early estimate, not a purchase decision.
Account for System Efficiency and Power Losses
Several losses stand between sunlight reaching the modules and usable AC power reaching the home. They include inverter conversion, wiring resistance, soiling, shade, module mismatch, high cell temperature, and equipment downtime.
For quick hand calculations, an overall factor between 0.75 and 0.82 is often used. A factor of 0.80 assumes that about 80% of the simple nameplate-times-sun-hours total becomes usable estimated production. It is a planning shortcut, not a guaranteed efficiency rating for every installation.
Do not automatically assign every system the same 20% loss. Professional tools model several losses separately, and a clean, unshaded array will not behave like one exposed to snow, dust, or afternoon shade. Ask the installer to disclose the assumptions behind the annual estimate.
Apply the Formula: A Worked Example
The basic formula is:
Daily Output (kWh) = System Size (kW) × Peak Sun Hours × System Efficiency Factor
Consider a 7 kW array and use 4.6 peak sun hours as an illustrative annual average. With a 0.80 factor, the calculation is:
Daily output: 7 × 4.6 × 0.80 = 25.76 kWh/day
Monthly output: 25.76 × 30 = approximately 773 kWh/month
If the same average held over a full year, the estimate would be about 9,402 kWh. Actual monthly production would not arrive in twelve equal portions. Longer summer days may produce well above the average, while short winter days, storms, snow cover, or seasonal shade may pull production below it. To calculate solar panel output, start with the formula above and then compare the result with a location-specific production estimate.
Use the result as a reasonableness check, then compare it with a site-specific model. A calculator based only on ZIP code and system size cannot see the oak tree beside the garage or the chimney shading three modules after 3 p.m.


How Much Energy Can Different Solar Systems Produce?
Larger arrays generally produce more electricity, but capacity alone does not determine the result. A well-oriented 8 kW system in an open, sunny location may outproduce a 10 kW system with substantial shade. Inverter limits and roof layout also influence how much of the panel capacity becomes usable energy.
The comparison below holds the sunlight and loss assumptions constant so the effect of system size is easy to see. It should not be read as a forecast for every U.S. home.
Estimate Monthly and Annual Solar Production
Daily production helps with load and battery planning, but monthly and annual totals are better for comparison with electric bills. Looking at a complete year prevents an unusually bright or cloudy month from distorting the decision.
Multiply estimated daily output by the days in a month or by 365 for a rough annual total. A better forecast uses monthly solar-resource data because January and July rarely produce alike. Owners of existing systems can compare the estimate with a full year of monitoring records. Comparing estimated generation with evening electricity use can help you assess whether a solar battery would make surplus daytime energy more useful.
Compare Output Across Different System Sizes
The following estimates use 4.5 peak sun hours per day and a 0.80 system factor. Monthly production is based on 30 days; annual production is based on 365 days.
System Size (kW) | Est. Daily Production | Est. Monthly Production | Est. Annual Production | Typical US Home Match |
5 kW | 18.0 kWh | 540 kWh | ~6,570 kWh | Small homes, townhouses, modest AC use |
8 kW | 28.8 kWh | 864 kWh | ~10,512 kWh | Average US single-family home (~900 kWh/mo) |
10 kW | 36.0 kWh | 1,080 kWh | ~13,140 kWh | Larger homes with heat pumps or an EV |
12 kW | 43.2 kWh | 1,296 kWh | ~15,768 kWh | High energy usage, pool pumps, multi-zone HVAC |
The last column is only a broad description. Actual annual use is more useful than labels such as “small” or “average.” Similar houses can have very different loads when one uses gas heat, and the other relies on electric appliances, a heat pump, and an EV. A solar panel output estimate is most useful when it reflects both system capacity and the conditions at the installation site.
Avoid sizing an array solely to erase the largest summer bill. Review at least 12 months of utility statements and note whether future changes are likely. An electric vehicle, heat-pump conversion, pool, home addition, or new water heater may justify capacity that current bills do not yet show.

What Factors Affect Solar Panel Output?
A calculator works from assumptions, while a roof operates in changing weather. Sun exposure, orientation, temperature, shade, equipment selection, and workmanship can all shift the result.
Local Sunlight and Seasonal Changes
Solar resource varies by location and season. The Southwest usually receives strong annual sunlight, while northern states face shorter winter days and lower sun angles. Solar can still work in a northern climate, but its production follows a different seasonal pattern.
A Minnesota array may produce far more in June than in December. Snow can cover modules temporarily, although cold, clear conditions can be productive once their surfaces are exposed.
Weather history is more useful than a “sunny days per year” figure. Panels continue generating under diffuse light on cloudy days, though at lower output. Address-based models generally use multiyear weather data so one unusual season does not control the estimate. For a more realistic estimate, solar panels should be evaluated against local sunlight and seasonal weather patterns rather than annual sunshine figures alone.
Panel Orientation, Tilt, and Shading
In the continental United States, an unobstructed south-facing array commonly provides the highest annual production. A roof does not need to face due south to be useful, however. East-facing panels begin producing earlier, while west-facing panels extend production later into the afternoon.
That timing matters under some time-of-use plans. A west-facing array may generate fewer annual kilowatt-hours than a south-facing one, yet produce more when grid electricity is expensive. The best design depends on both energy yield and the rate schedule.
Tilt affects sun exposure and how readily rain or snow leaves the surface. Most residential arrays follow the roof pitch when expected production is acceptable and the mounting method meets structural requirements.
Shade deserves a careful survey. A vent pipe may affect one corner for an hour; a large tree may cross much of the array in winter. Electrical design matters too because shade affects a traditional string differently from some microinverter or optimizer systems. A proposal should include a shade-adjusted estimate, not merely a satellite image.
Temperature and Weather Conditions
Solar modules need sunlight, but they do not gain efficiency simply because the day is hotter. As cell temperature rises, voltage falls and power output usually declines. This is why a bright, cool spring day can produce excellent results even when a hotter summer day receives stronger sun.
The 77°F rating point is a cell temperature used in standard testing, not the outdoor air temperature. Cells can become much hotter than the air in summer. A module’s temperature coefficient indicates how rated power changes as cell temperature moves above or below the test condition.
Clouds reduce incoming energy, sometimes abruptly. Rain lowers production during a storm but may rinse away loose dust. Snow, smoke, and airborne soil can also block light. Annual estimates should account for ordinary weather rather than treating every day as clear.
Installation Quality and System Performance
Good equipment cannot correct a careless layout. Modules placed in avoidable shade, loose electrical connections, poorly supported wiring, or an inverter that is inappropriate for the design can reduce production and create service problems.
An array is sometimes larger than its inverter’s AC rating by design, helping the inverter operate efficiently across more of the day. Brief clipping during the strongest solar hours is not automatically a flaw, but an unexplained mismatch should be questioned.
Monitoring provides the quickest warning of trouble. Compare similar days or monthly patterns rather than reacting to one low afternoon. A sustained decline, repeated fault code, or silent section of the array warrants service.
Panels usually require little maintenance. Pollen, bird droppings, leaves, or heavy soil may justify cleaning; follow the manufacturer’s instructions and avoid walking on the roof or using abrasive tools and pressure washers.
How Can You Use Your Solar Output Estimate?
Place the output estimate beside the home’s actual consumption. The comparison can suggest a sensible array size, likely midday exports, and whether battery storage fits the household’s goals.
Annual production does not translate into bill savings dollar for dollar. Electricity used immediately offsets retail purchases, while exports may receive the retail rate or a much lower credit. Fixed charges can remain even when annual production is close to annual use.
Compare Solar Production With Household Electricity Use
Collect 12 months of utility bills and total the kilowatt-hours, not only the dollars. Rates and fees can change even when consumption does not. Compare annual and monthly use with the production estimate.
Timing matters. An array may be busiest at noon while the household uses the most electricity after work. Pool pumps, laundry, water heating, and EV charging can sometimes be moved into solar-producing hours, raising direct use and reducing later grid purchases.
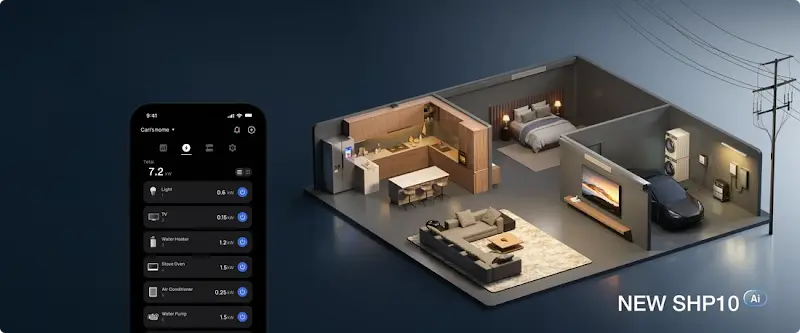
For circuit-level management and backup power, the EcoFlow TITAN 5000 Plus can pair with the compatible EcoFlow Smart Home Panel 10. The panel supports up to 10 selected circuits, and the EcoFlow App displays and manages energy flow in a properly configured system.
A qualified electrician should install the compatible EcoFlow Smart Home Panel 10 and complete the 120V/240V household circuit connections in accordance with the equipment instructions and applicable local electrical codes.
Estimate Potential Excess Solar Energy
Surplus solar is what remains after the home uses what it needs at that moment. Daily totals alone cannot show it. A house could produce and consume 30 kWh in one day while still exporting at noon and buying electricity after sunset.
Hourly or 15-minute utility data provides a better picture. Compare it with modeled solar production—or monitoring data after installation—to estimate direct use, imports, and exports.
Export compensation determines what the surplus is worth. Under one-for-one net metering, direct use and export may have similar bill value. With net billing, exports may earn much less than the retail price paid for evening imports, making load shifting or storage more attractive.
Assess Your Need for Energy Storage
Battery size should follow a purpose. Moving solar into the evening is different from preparing for a daylong outage. Begin with priority loads, running wattage, startup demand, and required operating time.
If the household regularly uses about 5 kWh after sunset, approximately 5 kWh of usable storage may be a starting point for daily load shifting. Some additional margin may be appropriate for conversion losses, reserve settings, battery aging, or outage protection. Capacity alone is not enough: the inverter must also supply the combined power and startup surge of the connected equipment.
If your output estimate shows regular daytime surplus, the next step is to determine how much of that energy could be stored and used after sunset. The EcoFlow TITAN 5000 begins with 5 kWh of battery capacity, accepts up to 4 kW of compatible direct solar input, and can expand to 30 kWh with compatible batteries. That modular range allows storage to grow if household use or backup goals change. Actual solar charging and runtime depend on panel configuration, weather, battery state, operating limits, and connected loads.
A day’s calculated PV production does not guarantee that the battery can store all of it. The home consumes some energy directly, charging power is limited, and a nearly full battery cannot accept another full day’s surplus. Design should account for generation, consumption, charge rate, and usable capacity by time of day.
Conclusion
A PV panel output calculator is a screening tool, not a production guarantee. Multiply rated capacity by site-specific peak sun hours and a reasonable loss factor, then compare the result with a model that accounts for roof direction, tilt, shade, temperature, and local weather.
Review a full year of household electricity use before choosing an array. Pay attention to when the home consumes energy as well as how much it uses. That timing determines how much solar is used directly, how much is exported, and whether a battery would provide meaningful value.
The final proposal should include a monthly forecast and disclose its assumptions. Those numbers allow homeowners to judge system size, expected bill offset, and storage needs using their own roof and energy habits rather than a national average.
FAQ
How Many Solar Panels Do I Need to Produce 40 kWh per Day?
You’ll need approximately 28 to 30 solar panels rated at 400 W each to generate an average of 40 kWh per day, assuming 4.5 peak sun hours and an 80% system efficiency factor.
For example, 28 panels provide 11.2 kW of capacity: 11.2 kW × 4.5 × 0.80 = 40.32 kWh/day
In sunnier locations with 5.5 to 6 peak sun hours, fewer panels may be sufficient. Actual output varies with weather, shading, and seasonal conditions.
Is 10kW Solar Enough to Run a House?
Yes, a 10kW solar system generates enough energy to cover the average American home’s daily electricity needs, typically supplying between 30 and 45 kWh per day. However, running heavy electrical loads simultaneously—such as central air conditioning, an electric vehicle charger, and an electric water heater—may still require grid assistance or battery support during overcast days and evening peak hours.
How Many Batteries Do I Need for a 20kW Solar System?
You will typically need between 20kWh and 40kWh of battery storage for a large 20kW solar array, which translates to two to four standard residential storage units (or an expandable unit paired with extra battery modules). Sizing depends primarily on your nightly power draw and backup priorities rather than solar array size alone, ensuring you capture surplus generation without leaving storage capacity unused.
Is It Better to Have More Solar Panels or More Batteries?
Investing in more solar panels is generally better if your utility offers generous 1:1 net metering and your primary goal is slashing annual electricity costs. Conversely, prioritizing extra battery capacity yields better returns if your local utility utilizes aggressive time-of-use rates, credits very little for exported power, or if your neighborhood frequently experiences weather-related grid outages.
For press requests or interview opportunities, reach out to our media team
media.na@ecoflow.com