NAO vs. AMO: Decoding the Atlantic’s Impact on Your Grid
- What Is The North Atlantic Oscillation And How It Moves Weather
- What Causes The North Atlantic Oscillation To Shift
- What Is The Atlantic Multidecadal Oscillation
- Connecting NAO And AMO To Winter Grid Risk
- How Winter Storms Become Grid Failures
- Resilience Options For Winter Weather Stress
- Plan For The Next Atlantic Winter
- FAQs
- Disclaimer
Atlantic climate systems influence winter weather and power risk patterns across broad regions. The north atlantic oscillation often drives seasonal weather swings that can bring cold snaps and strong storms. The atlantic multidecadal oscillation reflects longer shifts in ocean warmth that change the backdrop for weather extremes. When a warm Atlantic meets a negative NAO, winter stress on power grids can rise sharply.
What Is The North Atlantic Oscillation And How It Moves Weather
To see why winter grid risk can surge, start with the more rapidly changing pattern. The NAO describes the pressure difference over the North Atlantic between the subtropical high and the subpolar low. That contrast affects the jet stream and the paths of storms. When the index swings, winds and cold air shifts follow.
How Positive NAO Patterns Work
When the NAO is in a positive phase, the pressure difference is stronger. Westerly winds tend to be stronger and storm tracks stay farther north. This often brings milder, wetter conditions to parts of northern Europe and eastern North America. For grid operators, this can mean frequent wind and rain events that cause outages from falling trees and saturated soil bringing down lines.
How Negative NAO Patterns Change The Setup
A negative NAO phase appears when the pressure difference weakens or flips. A weaker contrast can slow or displace the jet stream. Cold air can spill farther south into parts of Europe or North America. Storm tracks can swing farther south, bringing snow, ice, or freezing rain to wide areas. Snow and ice accumulation on lines and towers can cause outages and slow repairs.
What Causes The North Atlantic Oscillation To Shift
The NAO moves because of shifting forces in the atmosphere. There isn’t a single trigger. Instead, it reflects a balance among pressure systems, upper-level winds, sea surface temperatures, and atmospheric circulation.
Pressure Patterns And Midlatitude Circulation
The core of the NAO comes from the ongoing tug-of-war between the Azores High and the Icelandic Low. When the high strengthens relative to the low, the pattern tilts toward a positive NAO. When it weakens, a negative NAO becomes more likely. Winds, wave patterns, and storm paths respond accordingly.
Jet Stream Position And Behavior
The NAO is tied to jet stream positioning. A strong pressure difference keeps the jet fast and zonal (west-to-east). A weakened difference allows the jet to meander and block, which can trap cold air in place. Blocking can prolong cold spells, intensifying grid stress when cold meets high demand.
Tropical And Stratospheric Influences
Tropical heating patterns, stratospheric wind changes, and Arctic conditions can also feed back into the circulation that helps set the NAO’s phase. These influences vary by season and year, making precise seasonal forecasting a probabilistic challenge rather than a certainty.
What Is The Atlantic Multidecadal Oscillation
The second Atlantic pattern works on a slower clock. The atlantic multidecadal oscillation, or AMO, refers to longer-term shifts in sea surface temperature over the North Atlantic. Warm and cool phases of the AMO can persist for decades.
Warm AMO Phase
During a warm AMO phase, large parts of the North Atlantic run warmer than their long-term average. This increases evaporation and moisture availability in the lower atmosphere. A warmer ocean can support stronger precipitation when a storm forms, though it does not cause storms alone. Instead, it tilts the background toward more abundant moisture and heat when other conditions align.
Cool AMO Phase
In contrast, a cool AMO phase reflects relatively lower sea surface temperatures. Storms can still be intense, but the moisture background differs. The cooler ocean can mean somewhat reduced moisture availability, which affects the energy available to winter systems.
Connecting NAO And AMO To Winter Grid Risk
NAO and AMO work on different scales. NAO shifts quickly and shapes seasonal weather patterns. AMO moves slowly over decades and sets a background on which seasonal swings play out.
| Climate Pattern | Time Scale | Primary Signal | Grid-Related Impact |
|---|---|---|---|
| North Atlantic Oscillation | Days to months | Jet stream and pressure change | Cold outbreaks, snow, ice, wind; sharp demand changes |
| Atlantic Multidecadal Oscillation | Decades | Sea surface temperature phase | Warmer or cooler background moisture and energy availability |
| Negative NAO + Warm AMO | Seasonal within warm decades | Moist air + cold air and blocked patterns | Higher chance of heavy snow, freezing rain, and stress on infrastructure |
A negative NAO can bring cold, but when that cold meets a warmer Atlantic, the resulting storms can be wetter and heavier. Heavy wet snow and ice loads can break lines and topple poles. Extended cold can raise demand for heating, stretching generation, fuel supplies, and backup systems.
How Winter Storms Become Grid Failures
A winter storm does not need to damage every part of a network to disrupt service. Chains of failures often start with peak demand, then get worse as supply and infrastructure struggle under simultaneous stress.
Demand Surges
Cold air drives up heating load. Electric heating systems, pumps, and control systems all draw power. If the cold covers large areas, neighboring regions that might normally share surplus generation are also in high demand. This leaves less backup to help.
Supply Challenges
Low temperatures can challenge generators, fuel systems, and transmission equipment. Frozen valves, brittle materials, and icing on outdoor substations reduce reliability. Fuel delivery can lag when roads are blocked or pipelines see cold-related pressure issues.
Infrastructure Damage
Heavy snow and ice weigh on lines and towers. Trees under snow loads can fall onto overhead lines. Flooding from snowmelt or rain-on-snow events can inundate substations, damaging transformers and controls. Coordination among grid operators, repair teams, and local authorities becomes critical.
Resilience Options For Winter Weather Stress
During long or repeated winter storms, portable power solutions can provide a buffer between grid failures and critical demand. Backup stations can run essential loads, communications, heaters, or small appliances.
Backup Power For Critical Loads
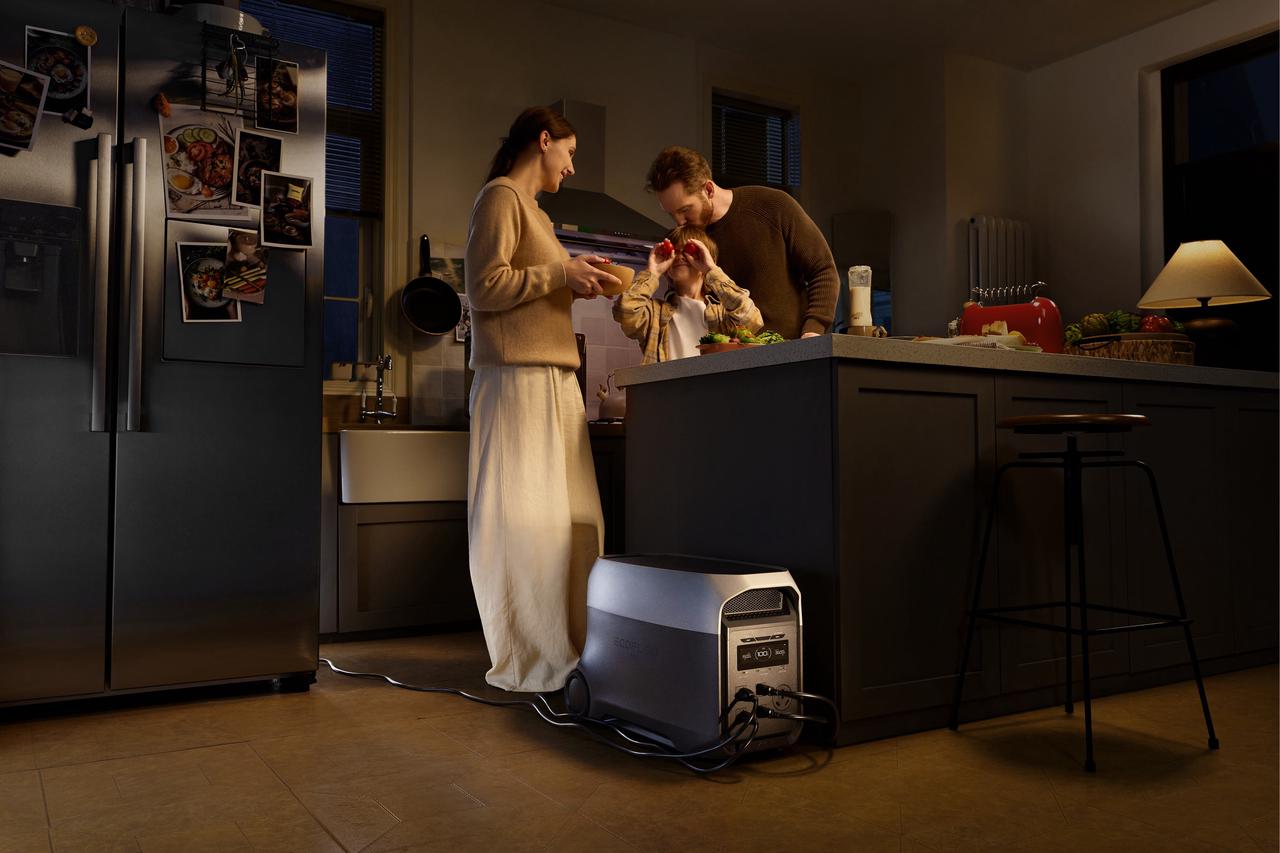
One portable option is the EcoFlow DELTA 3 Ultra Plus+500W Solar Panel, a powerful unit with a roughly 3 kWh capacity and strong continuous output rated at about 3600 W with 7200 W surge capability. It delivers AC and DC outputs to power multiple devices and essential circuits during an outage.
This type of station can keep lights, routers, communication gear, and heating-related peripherals running when the grid is under stress. It can also act as an uninterruptible power source for critical devices that cannot tolerate outages.
Beyond capacity and outputs, units like this often offer multiple ways to recharge, including AC input, solar panels, or generator support, helping them stay ready even during prolonged grid disruptions.
Site-Level Checks
Consider site-specific risk points. Overhead lines, old equipment, and isolated locations may face higher outage risk. Hardening service entrances, surge protection, transfer switches, and adequate fuel for backup generators are key planning steps.
Plan For The Next Atlantic Winter
Atlantic patterns do not give exact outage dates, but they can support earlier preparation. When the north atlantic oscillation turns negative during a warm atlantic multidecadal oscillation phase, winter storms may carry more cold, wind, snow, or ice risk. Check forecasts, test backup power, protect critical loads, and prepare before local grid stress becomes urgent.
FAQs
Q1: What is the north atlantic oscillation?
It is a pressure-based climate pattern over the North Atlantic. The north atlantic oscillation compares the pressure difference between the Azores High and the Icelandic Low. That pressure gap affects westerly winds, jet stream position, storm tracks, and cold-air movement, which is why it can shape winter conditions across parts of Europe and North America.
Q2: What does the atlantic multidecadal oscillation affect?
It affects the long-term ocean temperature background. The atlantic multidecadal oscillation refers to warmer and cooler phases in North Atlantic sea surface temperatures that can last for decades. These phases may influence moisture supply, regional temperature patterns, storm energy, and seasonal climate risk, though they do not decide individual weather events by themselves.
Q3: Can the north atlantic oscillation predict exact storms?
No, it cannot predict exact storms. The NAO is better used as a broad seasonal signal. It can suggest whether the atmosphere may favor colder outbreaks, stronger westerly winds, blocking patterns, or shifted storm tracks. However, exact storm timing, location, strength, and outage impact still depend on short-term weather forecasts and local conditions.
Q4: Does a warm AMO mean every winter will be bad?
No, a warm AMO does not mean every winter will be severe. It only suggests a warmer Atlantic background that may provide more moisture and heat for storms when other conditions align. Winter outcomes still depend on the NAO phase, jet stream pattern, Arctic air access, regional geography, and the condition of local power infrastructure.
Q5: Should individuals rely on NAO and AMO to make grid decisions?
No, they should not rely on NAO and AMO alone. These patterns can improve seasonal risk awareness, but grid preparation needs more specific information. Individuals and facility managers should also check local forecasts, utility alerts, outage history, backup power capacity, critical-load needs, fuel or recharge options, and the condition of electrical equipment before winter storms arrive.
Disclaimer
This article is for general educational purposes only. It does not provide meteorological, engineering, emergency, financial, or grid-operation advice. For official climate and energy-system information, refer to sources such as NOAA’s NAO monitoring page, NOAA’s AMO data resources, and the International Energy Agency’s electricity resilience materials. Local forecasts, utility notices, building codes, and licensed professionals should guide final preparation decisions.
For press requests or interview opportunities, reach out to our media team
media.na@ecoflow.com