Energy Monitoring System: How It Works and Tracks Energy Usage
Your electric bill tells you how much total electricity you used, but it rarely explains how that electricity was used. You cannot tell how much was used for the air conditioner, the pool pump, the EV charger, or small devices running quietly in the background.
A home energy monitoring system lets you drill down into usage to see how much was used where. A monitoring system tracks electricity use from your breaker panel, smart plugs, and circuits. It can show real-time power usage, usage trends, estimated costs, and, in some cases, solar and battery activity. This guide explains how energy monitoring systems work, what they can track, and how to choose the right setup for your home.
What Is an Energy Monitoring System?
An energy monitoring system shows how much electricity your home is using, most often in real time. When paired with a home battery, monitoring can also compare grid use with stored energy activity. Instead of waiting for a monthly bill, you can see when usage rises, which areas of the home use the most power, and see daily trends that affect your costs.
What Energy Monitoring Systems Do
A home energy monitor breaks down your electricity bill into identifiable pieces. Instead of a monthly utility statement with only a single aggregate number (kilowatt-hours used), these systems give you continuous, live feedback. They capture fluctuations in usage during the day, and day by day. They measure total electricity used, estimate real-time costs, and highlight phantom vampire loads. (These are electronics often in standby that silently drain power around the clock.)
Types of Home Energy Monitoring
Not every home requires the same level of detailed tracking. Depending on whether you live in a suburban home or an apartment, a home energy monitor system can vary significantly in features, installation complexity, and level of detail. Smart electrical panels add circuit-level visibility and, in compatible setups, active load control.
Monitoring Type | Where It Installs | What It Measures | Best Suited For |
Whole-Home Monitors | Main breaker panel | Total incoming utility power via current sensor clamps | Homeowners wanting overall consumption trends without rewiring circuits |
Circuit-Level Monitors | Breaker panel / Sub-panel | Individual breakers (kitchen, HVAC, laundry, EV charger) | Households tracking high-draw zones and managing backup power circuits |
Smart Plugs / Plug-in Meters | Wall outlets | Single appliances plugged into that specific outlet | Renters or users diagnosing specific units like a wine cooler or gaming PC |
Smart Panels & Storage Systems | Dedicated smart sub-panel | Bidirectional solar, storage batteries, and critical home circuits | Solar-plus-storage homes seeking active load control during outages |
Key Components of an Energy Monitoring System
Hardware designs differ between brands, but almost every reliable system relies on three fundamental pieces:
Current Transformers (CT Clamps): Ring-shaped magnetic sensors that snap safely around incoming service mains or branch wires to measure current draw.
The Central Controller / Gateway: A compact transmitter unit that’s connected to your local WiFi and is mounted inside or next to the breaker box. It takes raw analog measurements from the CT clamps, converts them into kilowatt data readings.
Cloud Platform & Mobile App: The software interface that receives data via WiFi or cellular connection and converts raw electrical numbers into easy-to-read charts, live displays, and cost calculations.
How Does an Energy Monitoring System Work?
Most monitoring systems are configured the same way. They use sensors to measure electricity usage, a controller sends the data to an app or dashboard, and the software turns those readings into charts, alerts, and cost estimates.
Collecting Energy Data
The data gathering process starts with the sensor on the copper wiring. Whenever an appliance draws electricity, the current induces an alternating magnetic field around that conductor. The CT clamps measure this field without any impact to your wires or interrupting your supply. At the same time, voltage sensors measure instantaneous line voltage. The sensors continuously measure both voltage and current waveforms together. The onboard microprocessor then accurately calculates real (active) power in watts. It does this by accounting for the phase difference and power factor in inductive loads like motors and compressors.
Sending Data to an App or Dashboard
Once all the calculations are done, this continuous stream of data is transmitted via the home’s WiFi or dedicated network connection to secure cloud servers. Dedicated servers and proprietary programs aggregate and analyze all the readings. They then generate reports for your home using actual kilowatt metrics, local weather trends, historical averages, and time-based utility rate schedules.
Turning Data Into Usage Insights
Looking at raw wattage curves won’t tell the average homeowner much unless converted into a meaningful context. The companion app takes that telemetry data and breaks it down into intuitive metrics. For example, it can give you instantaneous draw (e.g., “Your home is currently using 2.4 kW”), cumulative daily totals, and estimated costs based on your utility’s rate structure.
What Can an Energy Monitoring System Track?
The exact data depends on the supplier and equipment setup. A plug-in meter may track one appliance, while a whole-home or circuit-level system can show usage across your entire panel. This can include your solar panels, battery, and major loads.
Real-Time Electricity Use and Demand
When you open the app you can see your home’s current electricity usage in real time. If you turn on an electric range or the central AC, you may see the usage jump by 3,000 to 5,000 watts within seconds. This makes it easy to find out which appliances create the biggest demand spikes.
Historical Energy Consumption
Long-term data helps you identify detailed patterns that a monthly bill can’t. Daily, weekly, and seasonal charts can show you when winter heating loads are rising, or a pool pump is using more power than usual. You can also see how much your baseline consumption is and try to reduce those “vampire loads”.
Circuit- and Appliance-Level Energy Use
Whole-home monitoring gives you total power usage, while circuit-level monitoring can provide usage by dedicated circuits such as the kitchen, HVAC, lighting, laundry, or EV charger. Usually one circuit serves several outlets or fixtures. Thus circuit-level data shows the combined circuit usage but not every individual device on that circuit.
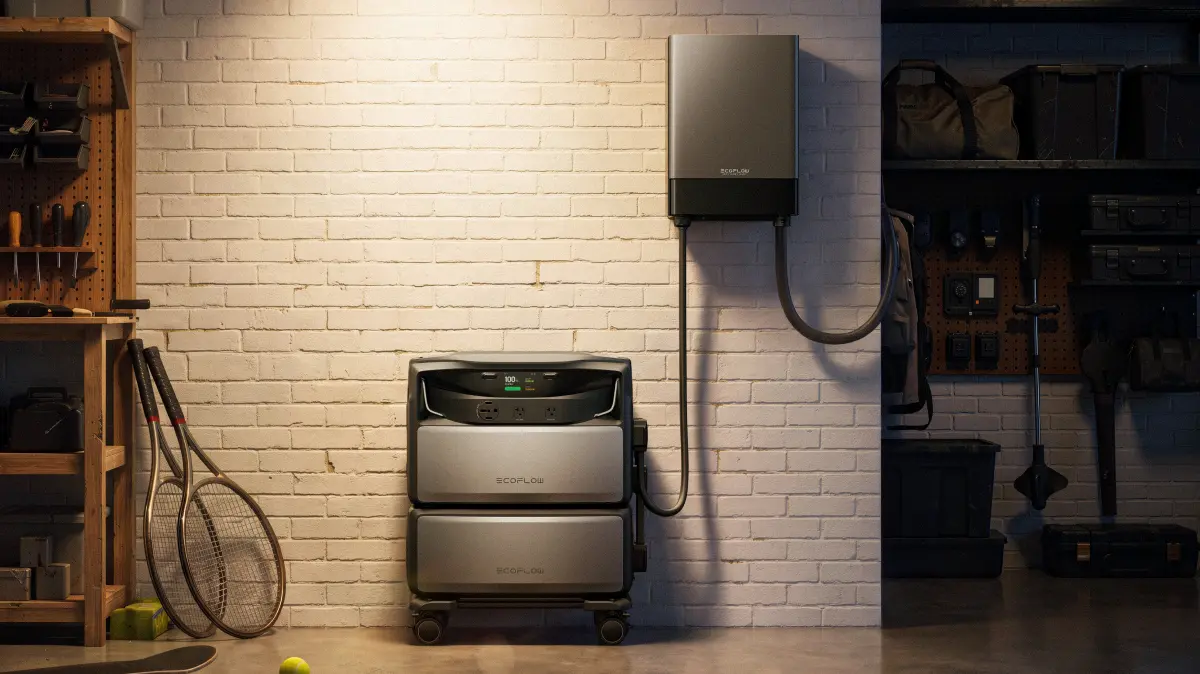
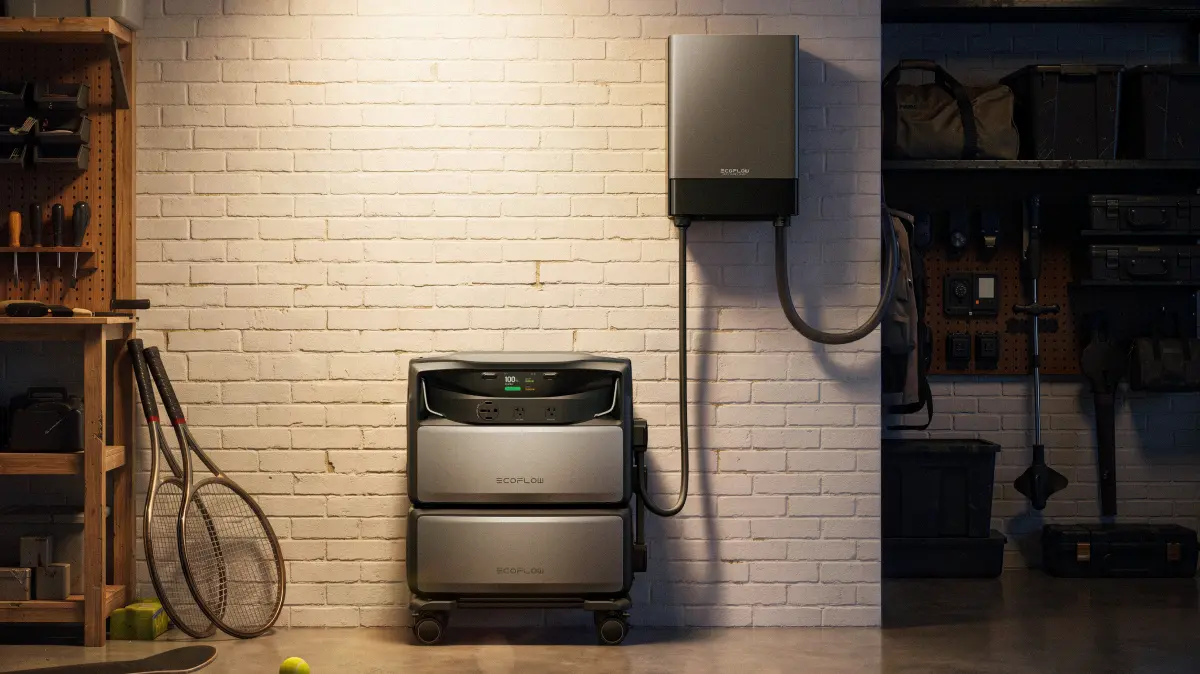
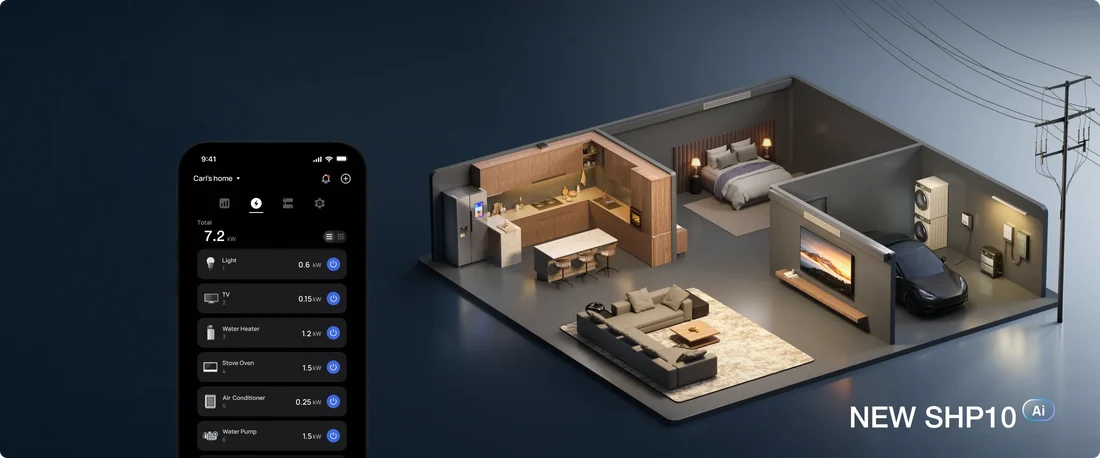
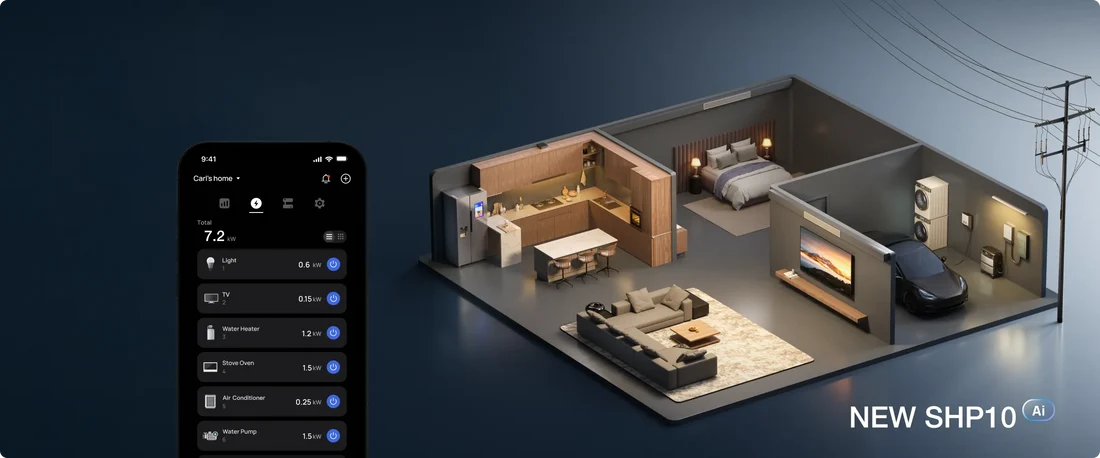
For integrated load management, you can combine an EcoFlow TITAN 5000 Plus with a compatible Smart Home Panel 10. This lets you view and manage up to 10 connected home circuits in the EcoFlow App. You can track key household loads and also choose which essential circuits to back up during an outage. A 120V/240V Smart Home Panel 10 connects to your residential electrical service and must be installed by a qualified electrician according to local electrical codes.
Electricity Costs and Time-of-Use Rates
If your utility uses Time-of-Use (TOU) rates, electricity used at 6 PM can cost far more than what’s used overnight. Many monitoring apps let you enter utility rate tiers and can estimate costs automatically by tier level. With this data, you can see how much appliance usage at peak-hours really adds to your bill.
Solar Generation and Battery Activity
For homes with solar panels and battery storage, useful monitoring can include how solar energy is being used, when the battery is charging or supplying power, and how stored energy is managed throughout the day. The EcoFlow TITAN 5000 Classic supports up to 3.2kW of compatible direct solar input. In a supported system configuration, users can set a daily operating strategy and adjust the solar self-consumption level through the EcoFlow App, while OASIS 3.0 coordinates solar generation, stored energy, and household demand around those settings. Circuit-level household monitoring requires the compatible EcoFlow Smart Home Panel 10.
When backup power needs to be distributed through the home’s electrical panel, TITAN 5000 Classic must be paired with a compatible 120V Smart Home Panel 10. A qualified electrician should complete the connection in line with local electrical codes.
How Can Home Energy Monitoring Help You?
Data is only helpful if it leads to practical benefits. Equipping your home with realtime monitoring provides three tangible advantages for your wallet and daily routine.
Identify High Energy Use and Unusual Changes and Patterns
Vampire loads and malfunctioning motors can raise household electricity use and costs. A continuous monitor helps you spot anomalies easily. For example, you identify a basement sump pump cycling every five minutes or an aging refrigerator in the garage that’s using twice its expected wattage. Catching these irregularities early can reduce repair costs as well as your electric bill. A home energy audit can help confirm where monitoring data points to broader efficiency or equipment problems.
Shift Usage to Lower-Cost Hours
Once you see your utility’s peak pricing windows overlayed with your usage patterns, you can try adjusting your household schedule. You can set EV chargers, pool filtration systems, and laundry cycles to run during off-peak overnight hours. This way you capitalize on using cheaper electricity rates without sacrificing household comfort.
Manage Solar and Battery Use
If you’re using solar panels, you want to maximize using that solar energy instead of selling back power to the utility. This is called self-consumption. Real-time solar power generation graphs allow you to match heavy household loads (like running an electric clothes dryer) directly with peak midday solar production. This prevents sending excess energy back to the grid at unfavorable net metering credits. If you also have battery backup storage, you’re less likely to export power and will store it.
How Do You Choose the Right Energy Monitoring System?
The right choice depends on your home, your electrical panel, and what level of detail you want. Some households only need basic whole-home visibility. Homeowners with solar systems, and battery backup-power setups usually benefit from more detailed circuit-level monitoring.
Check System Compatibility
If considering a home monitoring system, start by inspecting the inside of your main electrical panel. Check if there are physical breaker slots open for a dedicated monitor. Next, see if there is enough room to clamp CT sensors around the main service cables. If your home runs on a 200-amp split-phase 120V/240V panel, ensure the energy monitor can measure both legs separately. Homes with detached workshops or sub-panels may require additional units.
Compare Monitoring Features and Reports
Consider what level of detail you truly need. A simple whole-home clamp setup is inexpensive and quick to set up if your only goal is total usage. You still get much more information than a single monthly amount. However, if you plan to integrate battery storage, balance power between circuits, or prepare for power outages, choose a system with multi-circuit tracking and dedicated solar integration.
Review App Access, Privacy, and Subscription Costs
Before buying, review the provider’s software and usage policies. Most platforms provide basic metrics for free, but some require monthly subscription to access historical reporting or advanced appliance detection tools. Also, make sure the software offers local network access and has transparent cloud storage policies that fit your preferences.
Conclusion
Analyzing and managing your household energy costs is now possible without sifting through limited end-of-month electric bills. If you install an energy monitoring system, you have access to realtime, detailed data on where every kilowatt goes. These systems can show usage by your heavy duty units as well as background phantom loads. You can start with a simple whole-home sensor or step up to a dedicated smart sub-panel that manages backup power during an outage. Just having access to real-time data puts you back in the driver’s seat to manage your home’s efficiency.
FAQ
Are Home Energy Monitors Worth It?
Yes, home energy monitors are generally worth the investment, but the savings depend entirely on how you act on the data. While the device itself doesn’t save energy passively, studies show households that actively eliminate phantom loads, optimize HVAC schedules, or shift heavy appliances away from peak hours typically reduce their electric bills by 5% to 15%.
What Runs Your Electric Bill Up the Most?
Heating and cooling are major residential electricity uses, but their shares vary by climate, equipment, and fuel. EIA’s 2020 national estimates put air conditioning at 19%, space heating at 12%, and water heating at 12% of residential site electricity use; an individual home can differ substantially.
What Is the Difference Between a Smart Meter and an Energy Monitor?
A smart meter is owned and installed by your utility company to measure aggregate consumption for monthly billing, whereas an energy monitor is customer-owned hardware that provides instant, second-by-second data and circuit-level breakdowns. Utility smart meters typically report data on a delayed schedule (often 24 to 48 hours later) rather than giving you live feedback.
How Accurate Are Home Energy Monitors?
Quality home energy monitors equipped with commercial-grade CT clamps are typically accurate within 1% to 2% of actual electrical draw. Minor discrepancies usually stem from rapid line voltage variations if the system only samples current without an active voltage reference lead.
Can I Install My Own Energy Meter?
Plug-in smart monitors can be installed by anyone in seconds, but hardwired panel monitors should generally be installed by a licensed electrician. Working inside a live service panel exposes you to hazardous 120V/240V currents that remain energized even when the main breaker is switched off.
For press requests or interview opportunities, reach out to our media team
media.na@ecoflow.com