Average Rainfall in the US: How Wet Is Your State?

As the third-largest country by land mass in the world, the United States spans a remarkable range of climates, and rainfall is no exception. A resident of Seattle experiences something entirely different from someone in Phoenix, and understanding those differences matters more than you might think.
Whether you're planning a home renovation, considering a cross-country move, or simply getting ready for storm season, knowing your region's rainfall patterns helps you make smarter decisions.
Power outages caused by storms, flooding, and extreme weather are becoming increasingly common across the country, and having a reliable backup power solution can make all the difference.
The EcoFlow DELTA 3 Classic keeps your home running when the grid goes down, whether you're dealing with a Gulf Coast hurricane or a Midwest tornado. Don't wait for the next storm warning, explore EcoFlow's weather-ready portable power stations today.
Keep reading to learn where your state ranks in annual rainfall and what that means for your preparedness planning.
How Does Rainfall Vary Across the United States?
The Southeast receives some of the highest rainfall totals in the country, averaging between 50 and 60 inches each year. The Gulf of Mexico drives frequent thunderstorms and persistent humidity, while hurricane season brings the risk of serious flooding to coastal communities. If you live in a high-risk area, it's important to be prepared.
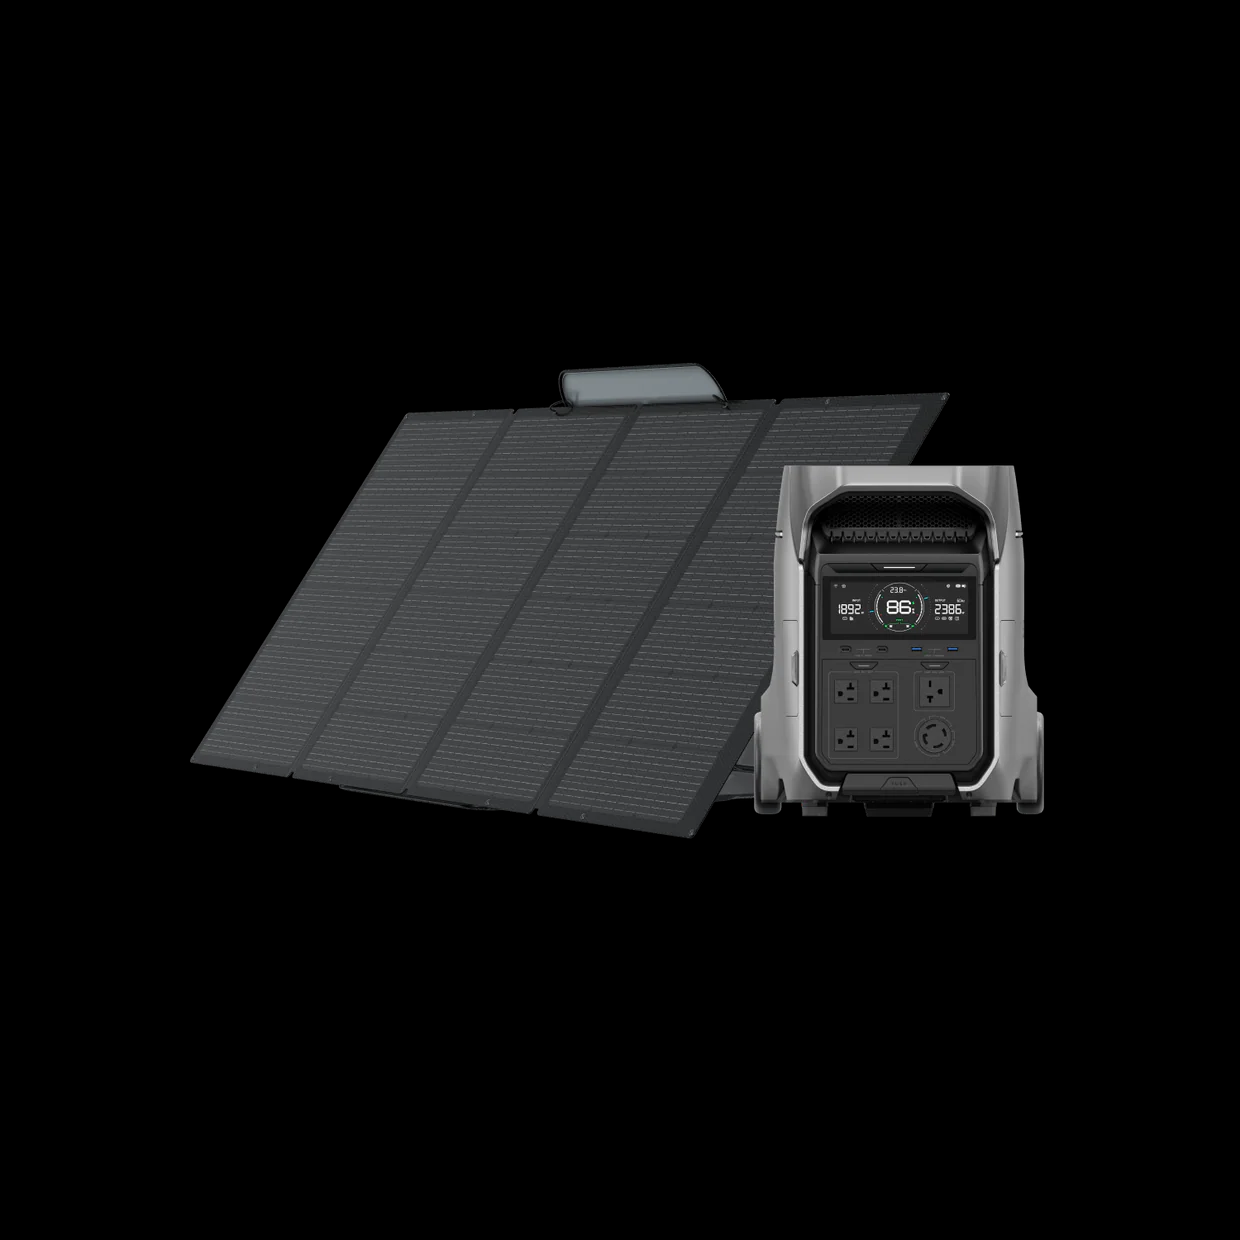
The Pacific Northwest is known for steady winter rain and overcast skies, with comparatively dry and mild summers. For households in this region, a solar generator such as the EcoFlow DELTA 3 Pro + 220W solar panel offers a smart way to generate and store renewable energy, even on cloudy days.
The Mountain West is highly variable. Dramatic changes in elevation create rain shadow effects, where one side of a mountain range can be lush and wet while the other remains dry.
The Midwest and Great Plains see moderate but seasonal rainfall, with spring and summer bringing intense thunderstorms and tornadoes. When severe weather knocks out the power, the EcoFlow DELTA Pro Ultra X provides clean, quiet backup energy to keep essentials running for hours on a single charge.
The Northeast experiences steady precipitation year-round, with nor'easters bringing wind, rain, and heavy snow, particularly along the coast, while the Southwest has a desert climate. Summer monsoons offer brief relief, but the region remains hot and dry for most of the year.
Which States Receive the Most Rainfall?
Hawaii, Louisiana, and Mississippi top the rankings with 63.7, 60.1, and 59.0 inches annually, respectively. At the other end of the scale, Nevada, Utah, and Wyoming receive just 9.5, 12.2, and 12.9 inches per year. Here's how every state compares, with the wettest month noted for each, as per the NOAA NCEI's Climate at a Glance tool:
Hawaii -63.7 in. | Wettest: December - Elevation and trade winds create dramatic variation across the islands.
Louisiana -60.1 in. | Wettest: July - Tropical storms and fall hurricanes drive significant flooding risk.
Mississippi -59.0 in. | Wettest: December - Hurricanes and tropical storms boost autumn rainfall totals.
Alabama -58.3 in. | Wettest: March - High summer humidity and heavy rain from tropical systems.
Florida -54.5 in. | Wettest: August - Frequent summer thunderstorms and hurricane influence; coastal flooding is common.
Tennessee -54.2 in. | Wettest: March - Humid climate with spring storms and warm, wet summers.
Georgia -50.7 in. | Wettest: July - Subtropical climate with regular summer thunderstorms.
Arkansas -50.6 in. | Wettest: May - High summer humidity and intense spring storm systems.
Connecticut -50.3 in. | Wettest: May - Rain year-round with humid summers and snowy winters.
North Carolina -50.3 in. | Wettest: July - Humid subtropical climate with additional rainfall from hurricanes.
South Carolina -49.8 in. | Wettest: July - Humid, with rainfall heavily influenced by coastal storms.
Kentucky -48.9 in. | Wettest: May - Evenly distributed rainfall throughout the year.
Rhode Island -47.9 in. | Wettest: March - Ocean-moderated temperatures with consistent precipitation.
Massachusetts -47.7 in. | Wettest: November - Cold winters and steady rainfall year-round.
New Jersey -47.1 in. | Wettest: July - Nor'easters in fall and winter; humid, stormy summers.
Delaware -45.7 in. | Wettest: July - Mild humid climate with summer thunderstorms.
West Virginia -45.2 in. | Wettest: May - Mountain terrain increases rainfall in certain regions.
Maryland -44.5 in. | Wettest: July - Frequent summer thunderstorms and an overall humid climate.
Virginia -44.3 in. | Wettest: July - Hurricanes add to rainfall totals; humid summers.
New Hampshire -43.4 in. | Wettest: June - Moderate summer rain and significant winter snowfall.
Pennsylvania -42.9 in. | Wettest: June - Humid summers, snowy winters, and evenly spread annual rain.
Vermont -42.7 in. | Wettest: June - Cooler summers and heavy winter snowfall.
Maine -42.2 in. | Wettest: November - Frequent spring and fall storms; humid continental climate.
Missouri -42.2 in. | Wettest: May - Humid summers and strong spring thunderstorms.
New York -41.8 in. | Wettest: July - Varies widely by region; humid summers and snowy winters.
Indiana -41.7 in. | Wettest: May - Humid climate with spring thunderstorms and mild winters.
Illinois -39.2 in. | Wettest: May - Late spring and early summer thunderstorms.
Ohio -39.1 in. | Wettest: June - Humid continental; lake-effect rain and snow in the north.
Washington -38.4 in. | Wettest: December - Wet coast; drier, sunnier summers east of the Cascades.
Oklahoma -36.5 in. | Wettest: May - Spring thunderstorms and tornado activity.
Iowa -34.0 in. | Wettest: June - Humid continental climate with summer thunderstorms.
Michigan -32.8 in. | Wettest: September - Lake-effect rain and snow; humid summers.
Wisconsin -32.6 in. | Wettest: June - Heavy winter snow contributes significantly to annual totals.
Texas -28.9 in. | Wettest: May - Rainfall varies widely across the state; coastal flooding is common.
Kansas -28.9 in. | Wettest: May -Intense spring storms; semi-arid conditions in the west.
Oregon -27.4 in. | Wettest: December - Wet winters on the coast; drier on the eastern side.
Minnesota -27.3 in. | Wettest: June - Humid continental climate with mild, wet summers.
Nebraska -23.6 in. | Wettest: May - Semi-arid west with strong spring and summer thunderstorms.
Alaska -22.5 in. | Wettest: September - Wet coastal regions; the interior is cold and dry.
California -22.2 in. | Wettest: January - Mediterranean climate: dry summers, wet winters.
South Dakota -20.1 in. | Wettest: June - Semi-arid west with summer thunderstorms.
Idaho -18.9 in. | Wettest: December - Heavy mountain snowpack dominates precipitation totals.
North Dakota -17.8 in. | Wettest: June - Dry winters and late-spring thunderstorms.
Colorado -15.9 in. | Wettest: May - Mountain influence; frequent sunshine overall.
Montana -15.3 in. | Wettest: June- Semi-arid; mountain snowmelt adds to annual totals.
New Mexico -14.6 in. | Wettest: August - Dry most of the year with summer monsoon storms.
Arizona -13.6 in. | Wettest: August - Hot, arid climate with summer monsoon activity.
Wyoming -12.9 in. | Wettest: May -Semi-arid; mountain snowmelt supplements annual totals.
Utah -12.2 in. | Wettest: March - Arid lowlands; higher precipitation at elevation.
Nevada -9.5 in. | Wettest: January - Desert climate with very little rainfall year-round.
Whatever the forecast, you don't have to face it unprepared. Explore EcoFlow's full range of backup power solutions and find the right fit for your state's climate, before the next storm rolls in.
Frequently Asked Questions
Which US States Are the Driest?
The Southwestern states, particularly Arizona, New Mexico, southern Nevada, and parts of California, are the driest in the nation. Occasional summer monsoons bring brief bursts of rain, but the desert climate keeps these regions hot and dry for the majority of the year.
How Is Rainfall Measured Across States?
Meteorologists use a combination of ground-based rain gauges, NEXRAD Doppler radar systems, and satellite observations to build an accurate picture of precipitation across the country. These methods complement each other to capture everything from localized downpours to broad storm systems.
Does Climate Change Affect Rainfall Patterns in the US?
Yes, and the effects are already well documented. As global temperatures rise, the atmosphere holds more moisture, which intensifies rainfall in already-wet regions while deepening drought conditions in drier ones. The result is more weather volatility, more extreme storms, and a higher risk of flooding in places that have historically been less vulnerable.
Power Through Any Storm with EcoFlow
No matter where your state falls on this list, one thing holds true across the country: weather is unpredictable, and the power grid isn't always reliable when you need it most. From Gulf Coast hurricanes to Midwest tornadoes to nor'easters battering the Northeast, severe weather can knock out power for hours, or days.
That's why EcoFlow's portable power stations are trusted by homeowners in every climate. The EcoFlow DELTA 3 Classic delivers clean, quiet power to run appliances, charge devices, and keep your household safe during any outage.
Pair it with an EcoFlow solar panel, and you have a renewable energy setup that recharges even on overcast days, ideal for the storm-prone Southeast, the rainy Pacific Northwest, or anywhere severe weather can disrupt the grid without warning.
Citations
Average Annual Precipitation by USA State — Current Results — https://www.currentresults.com/Weather/US/average-annual-state-precipitation.php
Assessing the U.S. Temperature and Precipitation Analysis in 2025 — NOAA NCEI — https://www.ncei.noaa.gov/news/national-climate-202513
Climate at a Glance — NOAA NCEI — https://www.ncei.noaa.gov/access/monitoring/climate-at-a-glance/statewide/rankings/31/pcp/202502
Monthly Climate Reports Annual 2024 — NOAA NCEI — https://www.ncei.noaa.gov/access/monitoring/monthly-report/national/202413
U.S. Annual Precipitation 2024 — Statista — https://www.statista.com/statistics/504400/volume-of-precipitation-in-the-us/
Rainfall Amount By State — PerfectWater — https://4perfectwater.com/blog/rainfall-amount-by-state
For press requests or interview opportunities, reach out to our media team
media.na@ecoflow.com