Flooding in the US Keeps Getting Worse. Why?
If it seems like coastal flooding and inland flash floods from extreme weather events are getting more frequent and devastating, that’s because they are.
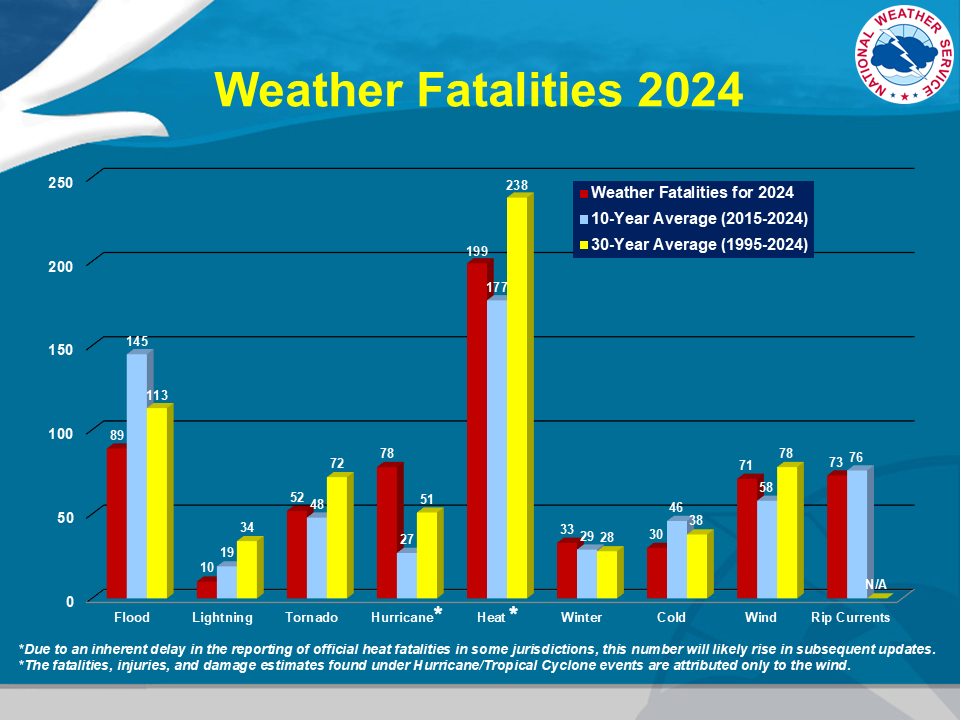
Floods are the second most common cause of weather-related deaths, next to extreme heat, and by far the most damaging to property.
As global average temperatures rise, so too do many extreme weather phenomena that trigger severe floods, such as tropical storms, hurricanes, and increased rainfall.
What are the causes and consequences of increased coastal flooding and inland flash floods?
Read on to find out.
The Dire Consequences of Flooding in Central Texas
In July 2025, devastating flooding took place in the Texas Hill Country.
The flooding began July 4th due to significant rainfall accumulating in Central Texas with six flash flood emergencies declared almost simultaneously.
The Guadalupe River rose about 26 feet in just 45 minutes and surged to 29 feet in the Hunt community, where over 20 children and counselors went missing from Camp Mystic, “a Christian summer retreat for girls.”
The BBC reports that at least 27 campers and one staff member died in the flood.
As of July 15, 2025, the New York Times reported that the Central Texas Flood left “at least 134 dead and nearly 100 still missing.”
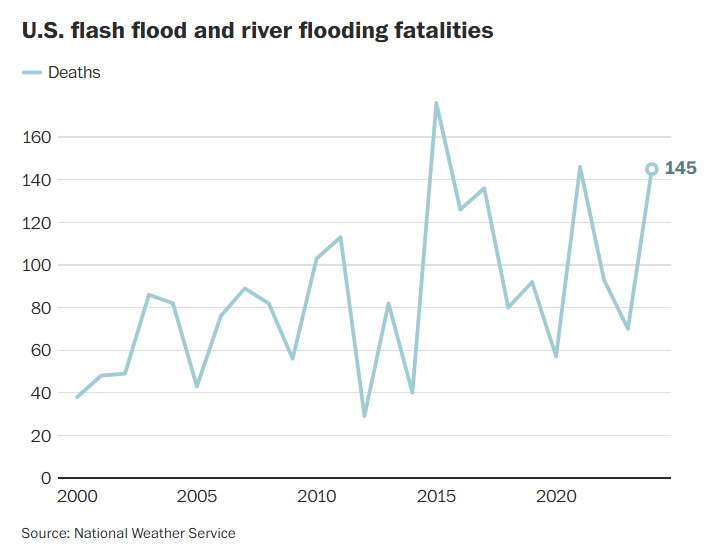
In 2024, there were 145 flood-related deaths in total, a dramatic increase from the 25-year average of 85 deaths a year.
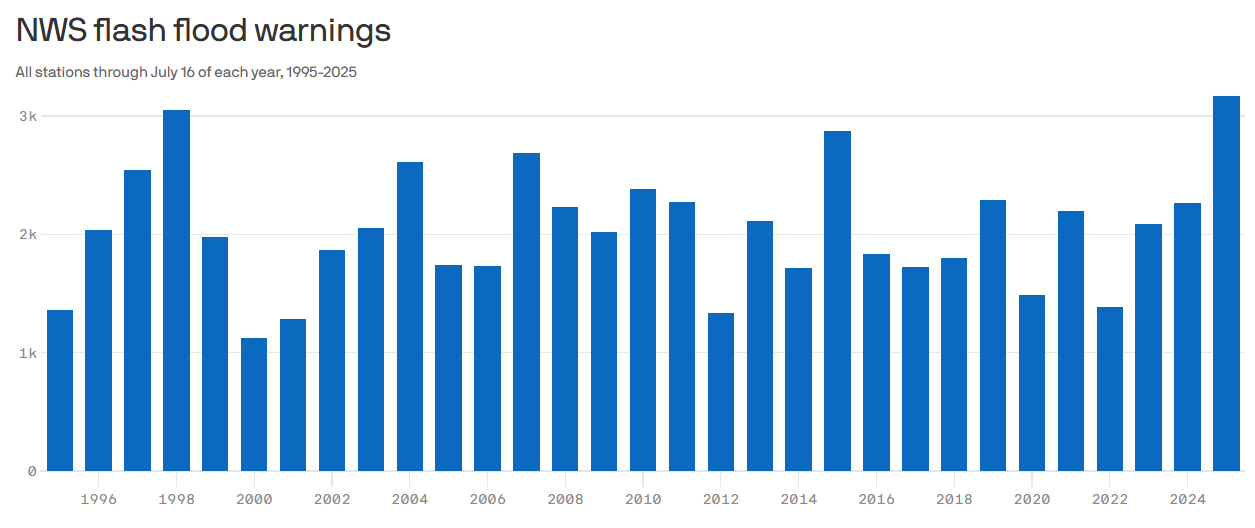
Why are floods in the US becoming more frequent and deadly?
(Source: Axios)
Why Floods Occur More Frequently
There are numerous reasons why floods are becoming more frequent and deadlier across the US.
Hurricanes and Tropical Storms
Tropical cyclones like hurricanes and tropical storms are among the leading causes of deadly flooding in the US.
Hurricane Helene alone was responsible for 95 deaths in 2024, over half the annual total.
High wind speeds define hurricanes, but it’s the surge in rainfall that often causes the most devastation from flooding.
(Source: Washington Post)
Freshwater Flash Flooding
A Washington Power investigation using data from the National Hurricane Center “found that freshwater flooding — the kind that occurs during heavy rainfall and swollen rivers — was responsible for 54 percent of all direct deaths from tropical cyclones in the United States between 2013 and 2024.”
This is a significant historical shift.
In the 50 years prior to 2013, storm surge caused by high winds that created ocean flooding in coastal areas was responsible for about 50% of hurricane deaths versus 27% of freshwater flooding.
Increased precipitation from ocean and atmospheric warming is likely causing flash floodwater flooding in areas like the Texas Hill Country, which is hundreds of miles inland from the nearest ocean coast.
(Source: NY Times)
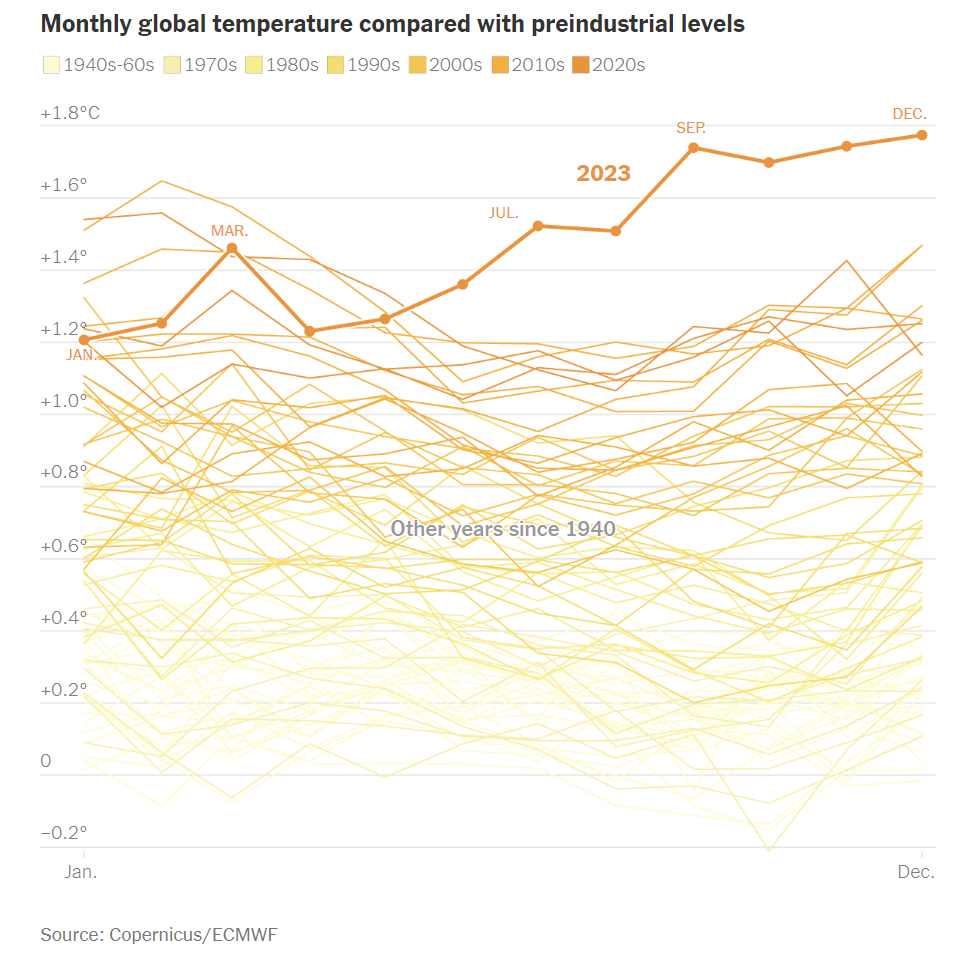
Climate Change: An Escalating Factor
There is near-global consensus among climate researchers and scientists that human-made greenhouse gas emissions are warming the Earth at a disastrous rate.
The consequences of climate change are already being felt in the US and worldwide, leading to more frequent and severe extreme weather events.
According to Jared Rennie, a research meteorologist at NOAA’s National Centers for Environmental Information, “there’s not enough data to know whether climate change has affected the frequency of flash floods. But the intense rainfall events that can lead to flash flooding have become more common.”
“A warmer atmosphere has the ability to hold more moisture,” Rennie told the Washington Post. “So more events like (the floods in) Central Texas and (from) Hurricane Helene could happen.”
(Source: HazStat)
The Vulnerable Areas: Who is Most Affected?
Second to extreme heat, flooding is the leading cause of weather fatalities in the United States.
Coastal areas have long dealt with floods from storm surge; however, freshwater flash flooding events are becoming more frequent and deadly.
Areas that may not have been considered at high risk for flooding 50 years ago are increasingly vulnerable, thanks in part to increased precipitation related to rising global temperatures.
The regions of the United States most vulnerable to flooding include:
Coastal Regions, particularly along the East and Gulf Coasts. Low-lying states like Florida, Louisiana, and New Jersey are susceptible to storm surge from tropical storms and hurricanes. Residents of densely populated cities like New York, Miami, and New Orleans also face significant risks.
Inland River Systems exacerbate flash flooding from heavy rainfall and other precipitation.
Rapidly Urbanizing Areas in growing states like California and Texas face additional danger when sewage and drainage systems become overwhelmed.
Emerging Inland Threats from Freshwater Flash Flooding are trending sharply upward in areas far from ocean coasts, such as the Great Plains, Appalachia, and Central Texas.
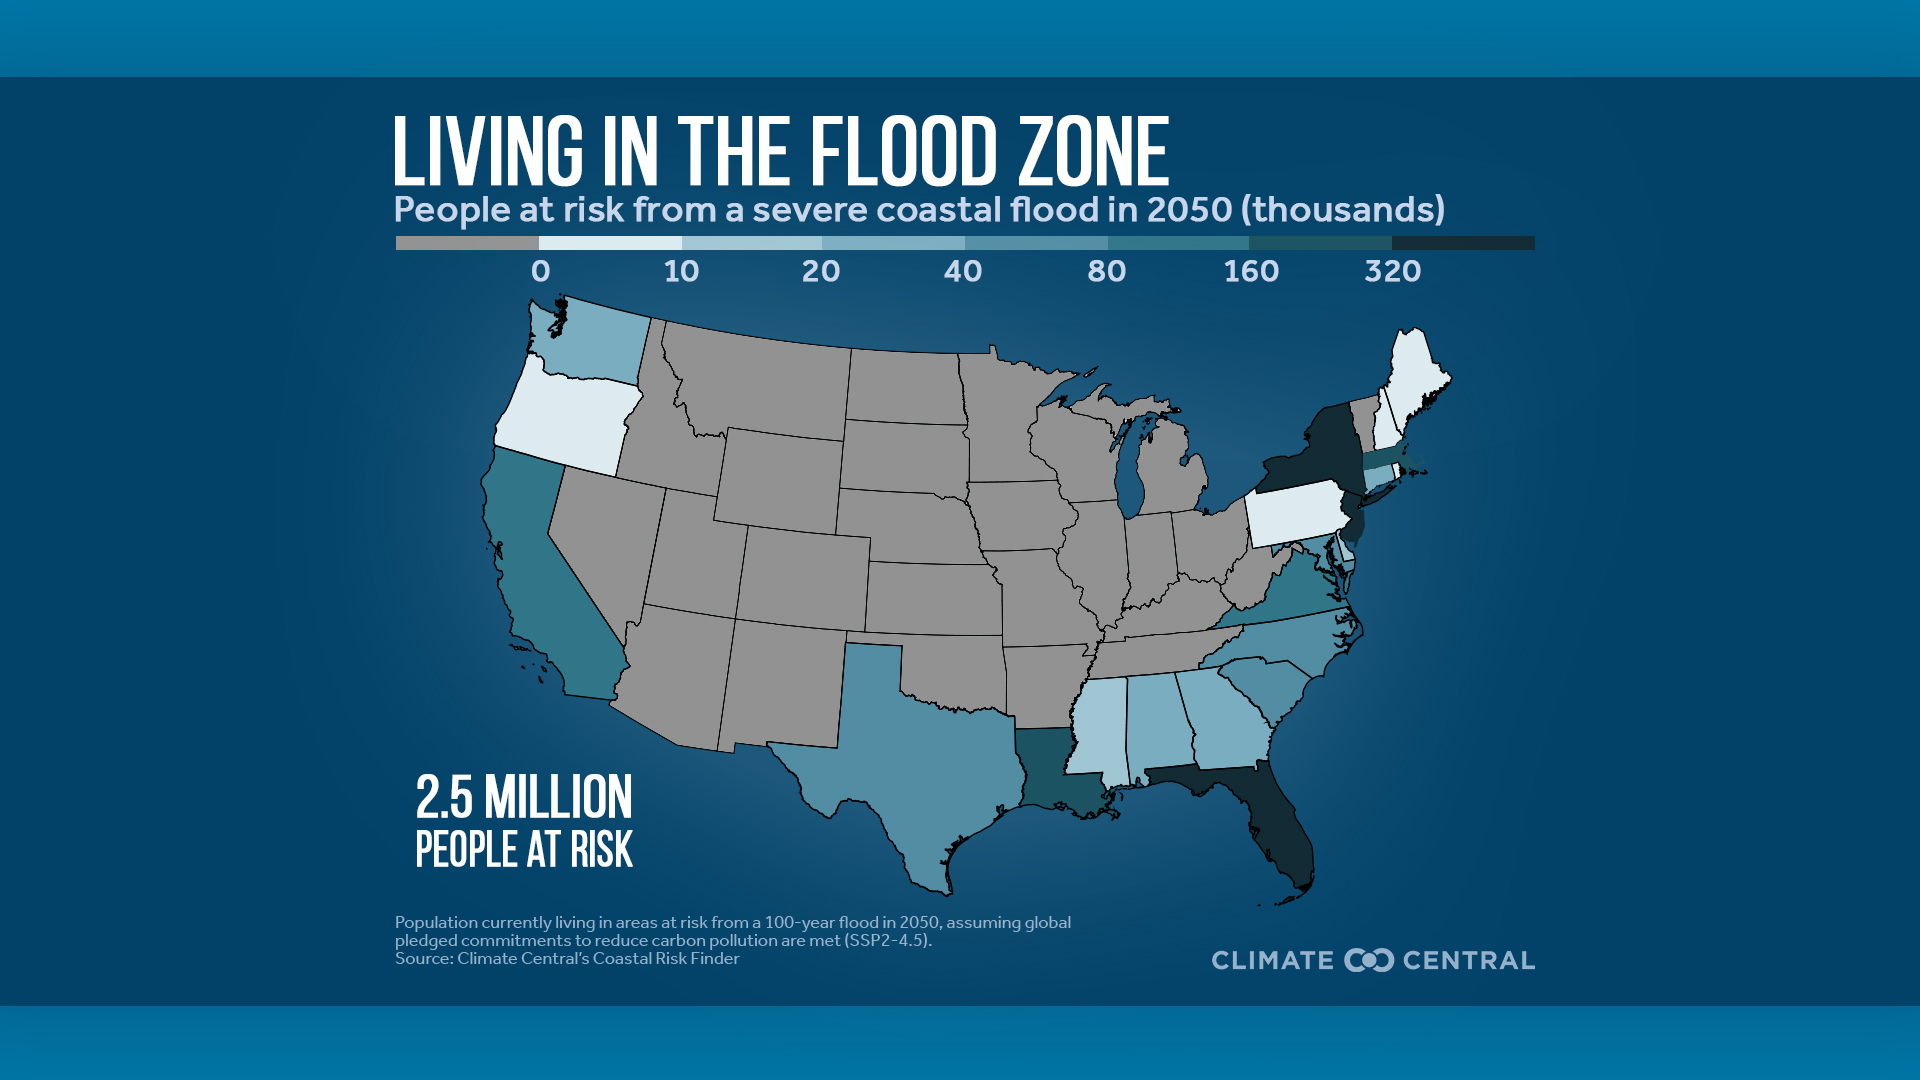
(Source: Climate Central)
Understanding Flood Risk Zones
Flood zones and flood maps published by the Federal Emergency Management Agency (FEMA) are a good starting point for understanding how likely you are to be hit by floods in your location based on historical trends.
However, FEMA has faced considerable criticism from experts who claim that many of the federal agency’s maps and other resources are many years out of date and don’t accurately reflect current levels of risk, particularly in inland areas that have experienced significant flooding in recent years.
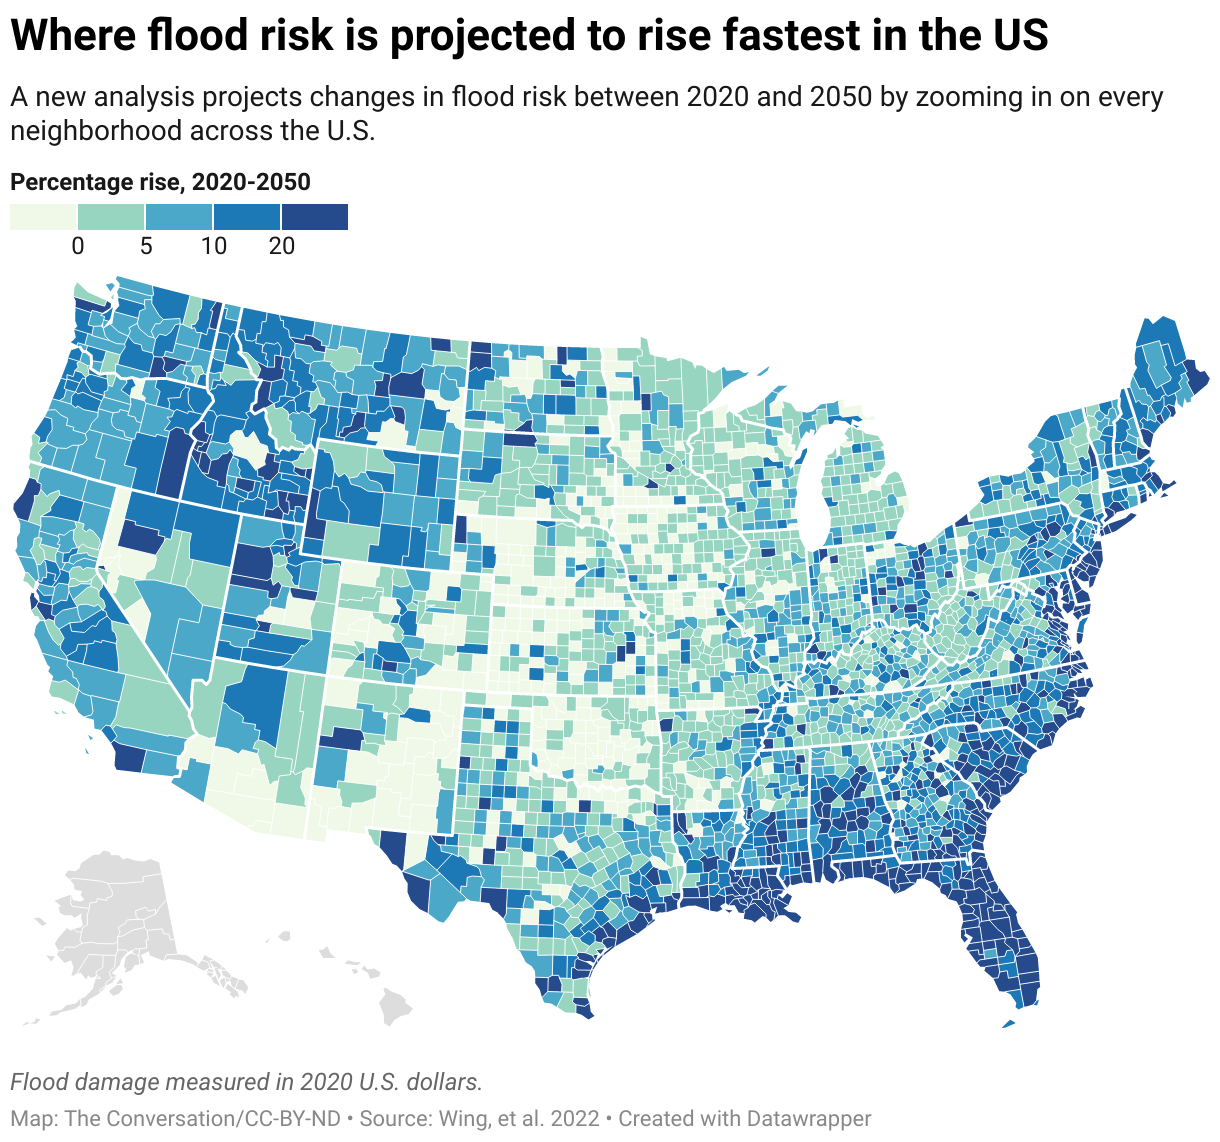
(Source: The Conversation)
A 2022 research paper warns that FEMA relies too heavily on historical data and doesn’t take into account the probability of substantially increased flooding from the effects of climate change.
FEMA’s FloodSmart website remains the best starting point for understanding the risks at your location.
What Are FEMA’s Flood Zones?
No area of the US is considered 100% safe from floods, but FEMA classifies regions by flood risk zones based on historical data as follows:
What is Zone A?
Zone A: Areas where there is a high risk of flooding. In communities participating in the NFIP, homeowners and businesses with federally backed mortgages must purchase flood insurance.
What is Zone V?
Zones V and VE are high risk coastal areas with an additional hazard from storm waves. These areas have a 26% chance of flooding over the life of a 30-year mortgage. In communities that participate in the NFIP, flood insurance is mandatory for federally backed mortgages.
What is Zone D?
Zone D: Areas where flood risk has not been determined and no flood hazard analysis has been conducted. Flood insurance rates are therefore proportionate to the uncertainty of the flood risk.
What is Zone B & X?
Zone B & X: Area of moderate flood hazard, usually between the limits of 100‐year and 500‐year floods. B Zones are also used to designate base floodplains of lesser hazards, such as areas protected by levees from 100‐year floods, or shallow flooding areas with average depths of less than 1 foot or drainage areas less than 1 square mile.
What is Zone C & X?
Zone C & X: Area of minimal flood hazard, usually depicted on Flood Insurance Rate Maps (FIRMs) as above the 500‐year flood level. Zone C may have ponding and local drainage problems that don’t warrant a detailed study or designation as base floodplain. Zone X is the area determined to be outside the 500‐year flood limit and is protected by a levee from 100‐year floods.
(Source: The Conversation)
Flooding In America: Disparities of Risk and Recovery
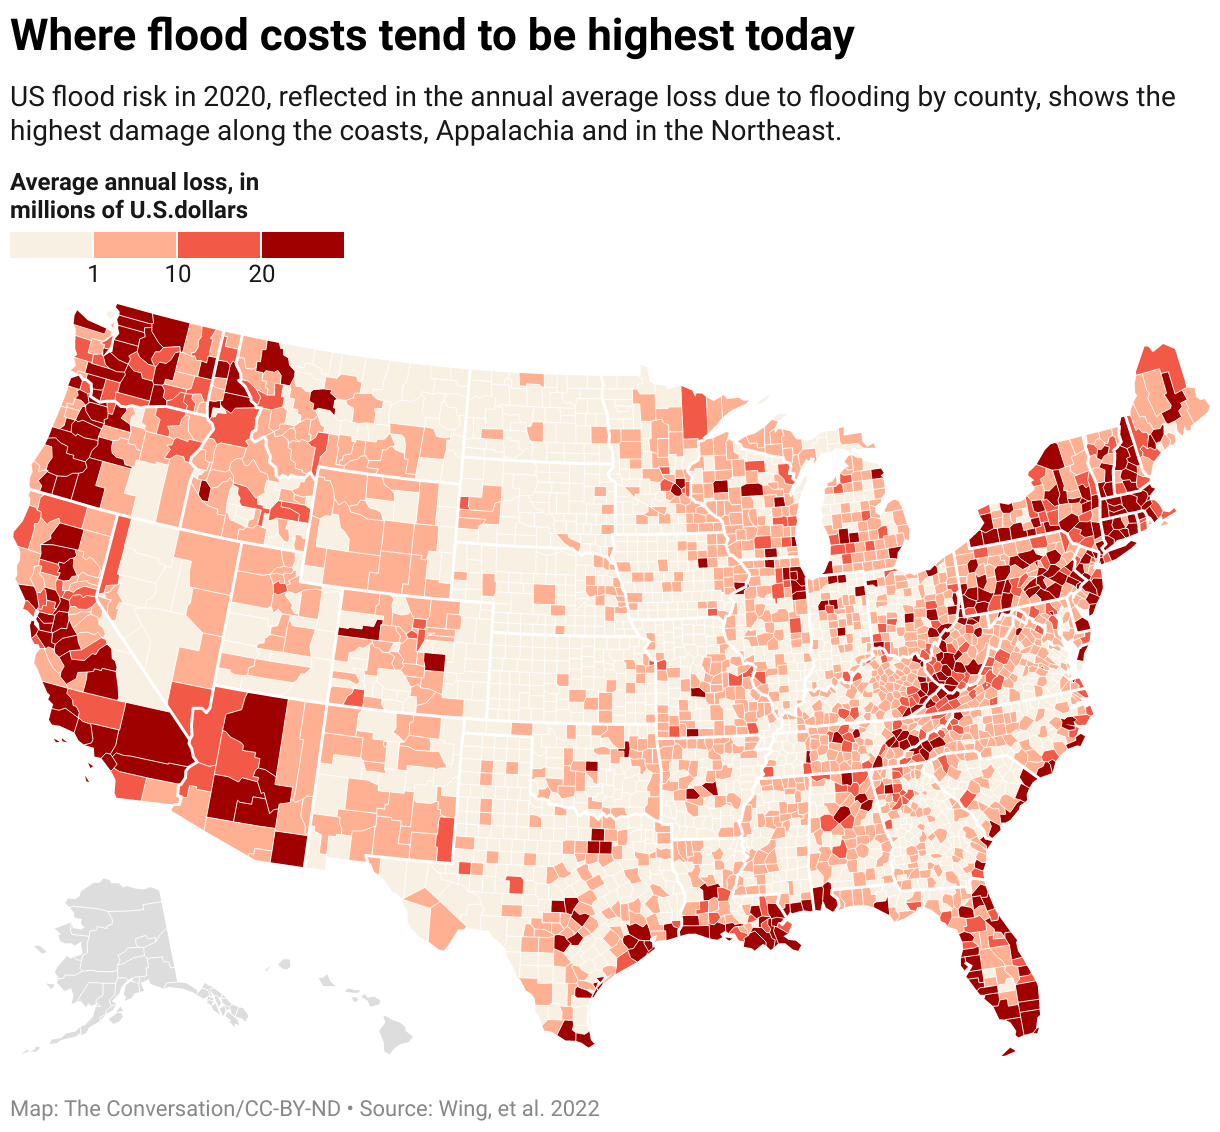
The Conversation estimates “that the annual cost of flooding today is over US$32 billion nationwide” and disproportionately impacts “communities in Appalachia, the Gulf Coast, and the Northwest.”
Impoverished communities in low-lying areas on the coasts and in the Appalachian valleys face an outsized burden of risk from floods.
As flash floods occur further inland and in crowded cities, economically disadvantaged communities are particularly vulnerable due to a lack of financial security and less investment in flood adaptation.
When disaster strikes, FEMA funding “focuses primarily on recovery and reconstruction of property, which favors homeowners and wealthier individuals.”
Low-income homeowners and renters are also far less likely to carry flood insurance than middle-to-upper-class individuals and families.
As flood frequency and intensity trend upwards, the most vulnerable populations are often the least prepared to deal with the risk and aftermath of severe flooding.

Prepare for Flooding with EcoFlow's Reliable Energy Solutions
Floods can happen quickly, and there’s nothing you can do to stop that.
However, flash flood preparedness can help minimize property damage and keep your family safe.
If you’re forced to shelter in place during a flood emergency, access to reliable home backup power can be a game-changer during the power outages that often accompany extreme weather events.
EcoFlow DELTA Pro 3 provides affordable, expandable essential home backup.
Unlike traditional portable generators, it’s whisper-quiet and safe for extended indoor use.
EcoFlow is the #1 leader in global sales of portable power stations, with a huge variety of recreational off-grid power and home backup solutions.
Check out our selection today.
Resources Cited
Hagan, Rachel. 2025. “‘Hero’ Dad, Twin Girls and Riverside Campers among Texas Flood Victims.” Bbc.com. BBC News. July 5, 2025. https://www.bbc.com/news/articles/c5ygl8lpyyqo.
Maag, Christopher, and Carter Johnston. 2025. “A Summer Camp on the Guadalupe River Reopens after Deadly Texas Flooding.” Nytimes.com. The New York Times. July 15, 2025. https://www.nytimes.com/2025/07/15/us/texas-flood-camp-reopens.html.
Bensen, Hannah, and Sarah Kaplan. 2025. “Flood Deaths Are Rising in the U.S., Fueled by Heavier Rainfall.” The Washington Post. July 8, 2025. https://www.washingtonpost.com/climate-environment/2025/07/08/freshwater-flood-deaths-increasing-rainfall/.
Gonchar, Michael. 2024. “30 Climate Change Graphs.” Nytimes.com. The New York Times. January 31, 2024. https://www.nytimes.com/2024/01/31/learning/lesson-plans/teach-about-climate-change-with-30-graphs-from-the-new-york-times.html.
Centers, National. 2025. “Climate Data Online (CDO) - the National Climatic Data Center’s (NCDC) Climate Data Online (CDO) Provides Free Access to NCDC’s Archive of Historical Weather and Climate Data in Addition to Station History Information. | National Climatic Data Center (NCDC).” Noaa.gov. Climate Data Online (CDO). 2025. https://www.ncei.noaa.gov/cdo-web/.
US. 2023. “Weather Related Fatality and Injury Statistics.” Weather.gov. 2023. https://www.weather.gov/hazstat.
“New U.S. Coastal Risk Map and Analysis | Climate Central.” 2025. Climatecentral.org. 2025. https://www.climatecentral.org/graphic/new-us-coastal-risk-map-and-analysis.
Wing, Oliver E. J., William Lehman, Paul D. Bates, Christopher C. Sampson, Niall Quinn, Andrew M. Smith, Jeffrey C. Neal, Jeremy R. Porter, and Carolyn Kousky. 2022. “Inequitable Patterns of US Flood Risk in the Anthropocene.” Nature Climate Change 12 (2): 156–62. https://doi.org/10.1038/s41558-021-01265-6.
Kousky, Carolyn, Jeremy Porter, Oliver Wing, and Paul Bates. 2022. “New Flood Maps Show US Damage Rising 26% in next 30 Years due to Climate Change Alone, and the Inequity Is Stark.” The Conversation. January 31, 2022. https://theconversation.com/new-flood-maps-show-us-damage-rising-26-in-next-30-years-due-to-climate-change-alone-and-the-inequity-is-stark-175958.
Wilson, Michael T., and Carolyn Kousky. 2019. “The Long Road to Adoption: How Long Does It Take to Adopt Updated County‐Level Flood Insurance Rate Maps?” Risk Hazards & Crisis in Public Policy 10 (4): 403–21. https://doi.org/10.1002/rhc3.12166.
Wilson, Bradley, Eric Tate, and Christopher T. Emrich. 2021. “Flood Recovery Outcomes and Disaster Assistance Barriers for Vulnerable Populations.” Frontiers in Water 3 (December). https://doi.org/10.3389/frwa.2021.752307.
Fussell, Elizabeth, and Elizabeth Harris. 2014. “Homeownership and Housing Displacement after Hurricane Katrina among Low-Income African-American Mothers in New Orleans.” Social Science Quarterly, September, n/a-n/a. https://doi.org/10.1111/ssqu.12114.
For press requests or interview opportunities, reach out to our media team
media.na@ecoflow.com