2025’s Disasters Are Breaking Cost Records
Does it ever seem to you like there are more hurricanes, heat waves, wildfires and flash floods than ever?
That's because there is.
Either the frequency or the severity — or both — of extreme weather events and natural disasters is trending up.
Way up.
At the halfway point of 2025, multiple records for extreme weather and disaster-related damages have already been smashed.
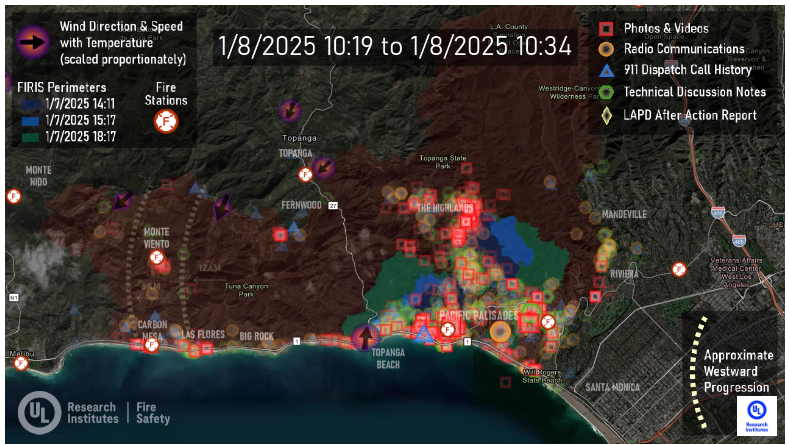
Palisades Fire Progression Evidence Timeline (Source: UL Research Institute)
Record Breaking Extreme Weather Events and Natural Disasters in 2025
1. Southern California Wildfires (Palisades & Eaton Fires)
Dates: January 2025
Location: Los Angeles and Southern California
The Palisades and Eaton Fires were the two most devastating of a series of wildfires driven by hurricane-level Santa Ana winds that ravaged Los Angeles and Southern California laying waste to entire communities like Altadena and Pacific Palisades.
Combined, the Palisades and Eaton fires destroyed over 16,000 structures including residential dwellings, public and commercial property.
The wildfires also claimed approximately 482 lives and caused over 3,000 injuries through direct and indirect causes.
Records:
The January 2025 Southern California Wildfires are the costliest wildfire event in U.S. history (over $60 billion in insured losses alone), and the most destructive fires in Los Angeles city history.
The most recent data, as of November 2025, breaks down damage costs as follows:
Total Economic Impact[1]: $112 Billion (surpassing Hurricane Katrina's $103 Billion unadjusted estimate)
Insured Losses: $68 Billion
Uninsured Losses & Infrastructure: $38 Billion
Suppression & Response Costs: $6 Billion
2. Central Texas Hill Country Floods
Dates: July 4–7, 2025
Location: Texas Hill Country
The Fourth of July holiday turned deadly in Texas Hill Country when inland flash floods claimed the lives of at least 135 people, including 27 campers and counselors at Camp Mystic, mostly young girls.
Early on July 4, 2025, a mesoscale convective vortex (MCV) dumped over 20 inches of rain on Texas Hill Country in under six hours.
A low-pressure center within a Mesoscale Convective System (MCS) that pulls winds into a circling pattern, or vortex. With a core only 30 to 60 miles wide and 1 to 3 miles deep, an MCV is often overlooked in standard weather analyses. But an MCV can take on a life of its own, persisting for up to 12 hours after its parent MCS has dissipated. This orphaned MCV will sometimes then become the seed of the next thunderstorm outbreak. An MCV that moves into tropical waters can serve as the nucleus for a tropical storm or hurricane.
In plain(er) English, an MCS "is a collection of thunderstorms that act as a [single] system. An MCS can spread across an entire state and last more than 12 hours."
Sometimes, when the system dies out, it leaves behind a spinning core of low pressure, that's the MCV.
Think of an MCV as a "ghost storm." It is a stalled leftover that can "take on a life of its own" long after the main storm appears to have vanished.
Because MCVs are comparatively small and continue after the rain from the major thunderstorm system has stopped on radar, forecasters may think the danger has passed.
However, these so-called ghost storms can rapidly reignite into violent, stationary thunderstorms, catching authorities and residents completely off guard.
The MCV in Texas Hill country caused the Guadalupe River to set a terrifying flash flood record.
The rate-of-rise of the Guadalupe River flash flood during the event was measured at 26 feet in just 45 minutes (over 31 feet total in under 90 minutes), creating a wall of water that arrived at dawn with no advance warning.
Flash floods are becoming more frequent, deadly, and occurring further inland than in the past.
Inland flash floods can be particularly devastating in locations like Texas Hill Country because authorities are ill-prepared to handle extreme weather events that have rarely (or never) occurred in the past.
Record: Deadliest U.S. inland flooding event in nearly 50 years. Set a speed-of-rise record for inland flash floods, by surging 26 to 31 feet in under 90 minutes.
3. First Half of 2025 Economic Damages
Dates: January - June 2025
Location: United States
The first half of 2025 was the costliest 6 months in US history for natural-disaster related events.
Disasters like the January Southern California wildfires and the flash flood in Texas Hill Country, summarized above, were contributors to over $101.4 Billion worth of economic damage at the midpoint of the year.
Another major contributor to the economic toll was a relentless string of severe storms and tornado outbreaks across the Central and Southeastern U.S. in the spring.
Record: Costliest first half of a year for natural disasters on record.
4. Northeast & Midwest Heat Dome + The Billion-Dollar Disaster
Date: June 2025
Location: US
These separate but related "heat dome" events set several records and made life miserable for much of the US in June 2025.
Heat waves have become the new normal across the country, but two June 2025 heat dome events were unprecedented.
Connecticut, Maine, Massachusetts, New Hampshire, New York, Rhode Island, and Vermont all broke their all-time June temperature records.
At the same time, the highest ever dew point (humidity) levels were recorded in the Northeast.
The combination of heat and humidity led to extremely dangerous wet-bulb temperatures and a record-breaking number of heat-related emergency room visits in cities like Boston and NYC.
Records
1. Temperature Records (Absolute Heat)
All-Time June State Records: Seven states broke their all-time high-temperature records for the month of June:
Connecticut: 103°F
Maine: 105°F (The most significant anomaly, shattering the previous record of ~98°F).
Massachusetts: 104°F
New Hampshire: 102°F
New York: 104°F (Upstate regions).
Rhode Island: 101°F
Vermont: 101°F
Warmest June on Record: For the Northeast region as a whole (NOAA Climate Division), this was the hottest June since record-keeping began in 1895, surpassing the previous benchmarks set in 2021 and 2024.
Duration Records:
Burlington, VT: 9 consecutive days above 90°F (previous record was 6).
Caribou, ME: 5 consecutive days above 90°F (unprecedented for this latitude).
2. Atmospheric & Humidity Records (The "Muggiest" Event)
Highest Dew Point Ever Recorded:
Boston Logan Airport: Recorded a dew point of 85°F. (For context, a dew point of 75°F is considered "oppressive," and 80°F is rare even in the tropics. 85°F is virtually unheard of in New England history).
Highest Heat Index (Feels Like):
New York City (Central Park): Heat index peaked at 122°F, the highest ever recorded in the city, driven by the extreme moisture.
Hartford, CT: Heat index peaked at 118°F.
Highest Minimum Temperatures (Warmest Nights):
New York City: Did not drop below 84°F for three consecutive nights, setting a record for the warmest "low" temperatures in city history. This "lack of cooling" is a primary driver of mortality.
3. Infrastructure & Economic Records
Grid Demand: ISO New England (the grid operator) reported the highest peak electricity demand for the month of June in history, exceeding 26,000 MW, as air conditioning use surged to 98% capacity.
Economic Classification: This was the first time a heatwave in the Northeast was individually classified as a Billion-Dollar Disaster by NOAA solely due to heat/humidity impacts (crop failure, healthcare costs, and infrastructure strain) rather than accompanying storms.
4. Health & Safety Records
Hospitalizations: Boston and New York City public health systems recorded the highest single-week volume of heat-related emergency room admissions on record, surpassing the infamous heatwaves of 1936 and 2006.
Water Temperatures: Lake Champlain (VT/NY) reached its earliest recorded surface temperature of 75°F, occurring three weeks ahead of the previous record, causing massive localized fish kills.
5. The "Missed" Hurricane Season
Dates: June - November 2025
Location: Pacific and Atlantic Coasts
After all that bad news, here's some good climate and weather-related disaster news for a change.
For reasons scientists haven't been able to definitively explain, other than dumb luck, as of 11/29/2025, it's the first year since 2015 that the continental US has had zero hurricane landfalls.
2025's hurricane season lucky streak is the most fortunate in 10 years.
It's not like there was a shortfall of potential disasters offshore.
Despite 21 named storms and 11 hurricanes forming in the Atlantic, a persistent trough of low pressure off the East Coast acted as a forcefield, curving every single hurricane back out to sea before it reached the coastline.
The only tropical cyclone to impact the US was Tropical Storm Chantal, which ended up being a weak, disorganized system that caused minimal (if any) recorded damage.
Hurricane Melissa caused significant damage in Jamaica and Cuba, but the US was spared a potential catastrophe when it failed to make landfall.
Melissa is the strongest Atlantic hurricane on record to never make landfall. It achieved peak sustained winds of 185 mph but remained offshore.
CNN called Hurricane Erin "one of the fastest rapidly intensifying storms in Atlantic history,” but the closest it got to the continental US was about 200 miles southeast of Cape Hatteras on North Carolina's Outer Banks.
Records
1. Highest Accumulated Cyclone Energy (ACE) ever recorded for a season with zero U.S. hurricane landfalls.
2. The Luckiest Year: First time in 10 years (since 2015) that the continental U.S. had zero hurricane landfalls.
3. Hurricane Category 5 Frequency (Second-Most All-Time): The 2025 season produced three separate Category 5 named hurricanes (Melissa, Nathan, and Ophelia), just short of the all-time record of 4 set in 2005. It is statistically rare to have multiple Category 5 hurricanes in one year, making 2025 one of the most violent seasons in history, despite the lack of landfalls.
Other Notable Disasters in 2025
The following events may not have broken any significant records, but they caused significant damage and, in the case of The Great Kamchatka Earthquake, tsunami warnings in the US.
The Gulf Coast Blizzard (Storm Éowyn)
Dates: January 20–22, 2025
Location: Texas, Louisiana, MS, AL, FL Panhandle
Return of the EF5 Tornado (Enderlin Tornado)
Dates: June 20, 2025
Location: Enderlin, North Dakota
Dates: March 13–16, 2025
Location: Midwestern and Southern US
Date: July 29–30, 2025
Location: Kamchatka Peninsula, Russia
(Source: NOAA)
Conclusion
With one month left in 2025 at time of writing, it's too early to say whether 2025 will end up being the costliest year for natural disasters yet…
However, the extraordinarily quiet hurricane season makes it less likely than it was after the first 6 months of the year.
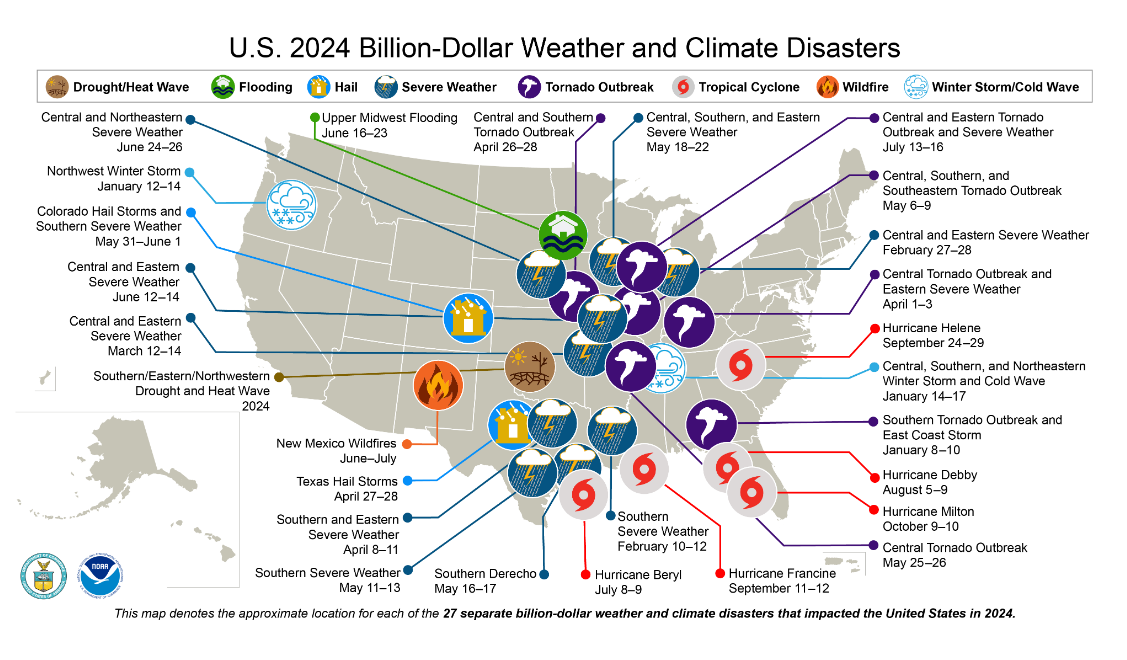
Billion-dollar weather and climate disasters, as shown in the above NOAA map from 2024, are trending upwards.
At least temporarily, they may also be getting harder to track.
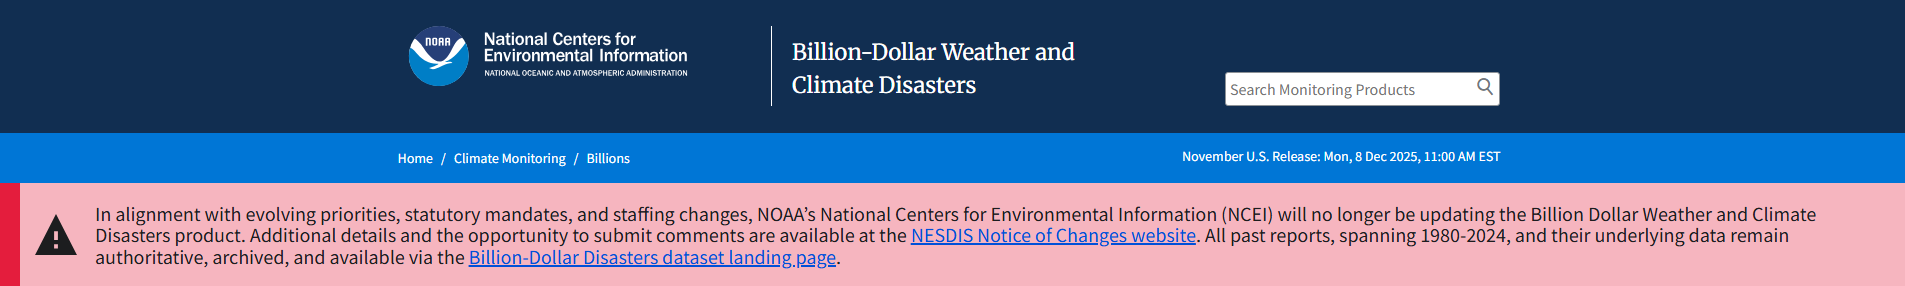
As of November 29, 2025, a red notice on the NOAA website reads:
In alignment with evolving priorities, statutory mandates, and staffing changes, NOAA’s National Centers for Environmental Information (NCEI) will no longer be updating the Billion Dollar Weather and Climate Disasters product…
All past reports, spanning 1980-2024, and their underlying data remain authoritative, archived, and available via the Billion-Dollar Disasters dataset landing page.
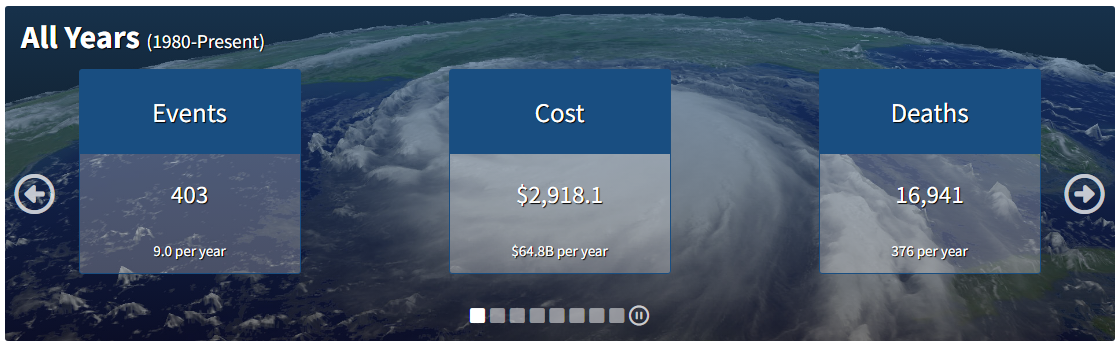
During the years the "Billion Dollar Weather and Climate Disasters product" was fully operational, from 1980 - 2024, the NOAA overview states:
The U.S. sustained 403 weather and climate disasters from 1980–2024 where overall damages/costs reached or exceeded $1 billion (including CPI adjustment to 2024). The total cost of these 403 events exceeds $2.915 trillion.
Resources Cited
Aon Impact Forecasting. "Global Catastrophe Recap: First Half of 2025." Aon. https://www.aon.com/home/solutions/reinsurance/impact-forecasting
California Department of Insurance. "Press Releases." California Department of Insurance. https://www.insurance.ca.gov/0400-news/0100-press-releases/
ISO New England. "News and Media." ISO New England. https://www.iso-ne.com/about/news-media/
Kerber, Steve, Derek Alkonis, Daniel Gorham, and Gavin P. Horn. "Southern California Fires Timeline Report." UL Research Institutes. November 20, 2025. https://fsri.org/research/california-fires-independent-analysis
National Centers for Environmental Information. "Billion-Dollar Weather and Climate Disasters." National Oceanic and Atmospheric Administration. https://www.ncei.noaa.gov/access/billions/
National Centers for Environmental Information. "Climate Monitoring." National Oceanic and Atmospheric Administration. https://www.ncei.noaa.gov/access/monitoring/monthly-report/
National Hurricane Center. "Tropical Cyclone Reports: 2025 Atlantic Hurricane Season." National Oceanic and Atmospheric Administration. https://www.nhc.noaa.gov/data/tcr/
National Interagency Fire Center. "Statistics." National Interagency Fire Center. https://www.nifc.gov/fire-information/statistics
Pacific Tsunami Warning Center. "Tsunami Message Archive." National Oceanic and Atmospheric Administration. https://www.tsunami.gov/
Texas Division of Emergency Management. "Situation Reports." Texas Department of Public Safety. https://www.tdem.texas.gov/
U.S. Geological Survey. "National Water Information System: Web Interface." U.S. Department of the Interior. https://waterdata.usgs.gov/nwis
For press requests or interview opportunities, reach out to our media team
media.na@ecoflow.com